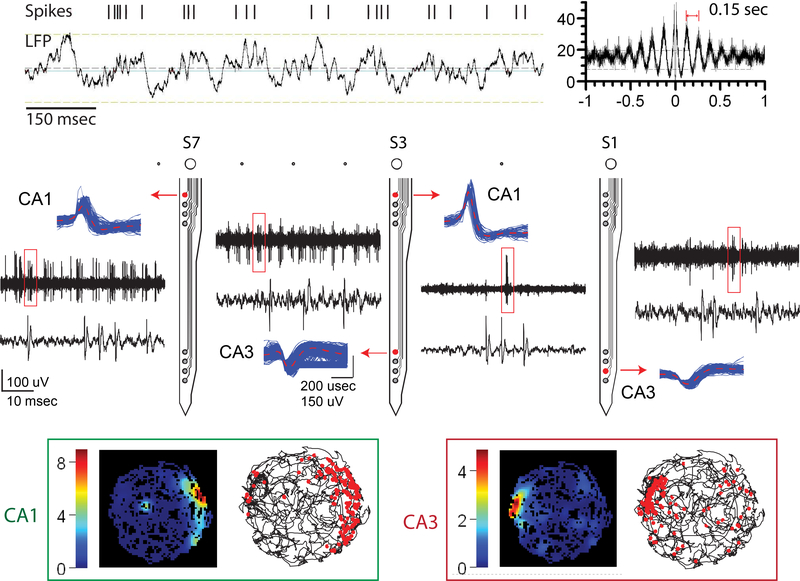
Figure 3.
Recording results from behaving animals. The middle panel shows both unitary activities and high-pass filtered, continuously recorded signals from one chronically implanted Parylene array while the animal ran freely in the open field. Neural activities were recorded from both the CA1 and the CA3 sub-regions. The top panel shows an example of a theta cell, whose firing rate increases when there is theta rhythm (4 to 7 Hz) presents. The autocorrelation of the same unit is shown on the right side. The bottom panel shows two place cells recorded with this Parylene array from the CA1 and the CA3 sub-regions respectively. Two color maps on the left side plot the firing rates of these units regarding to the animal’s position in the open field. Pictures on the right side show the moving trace of the animal and each red dot represents one spike firing in that particular location.

