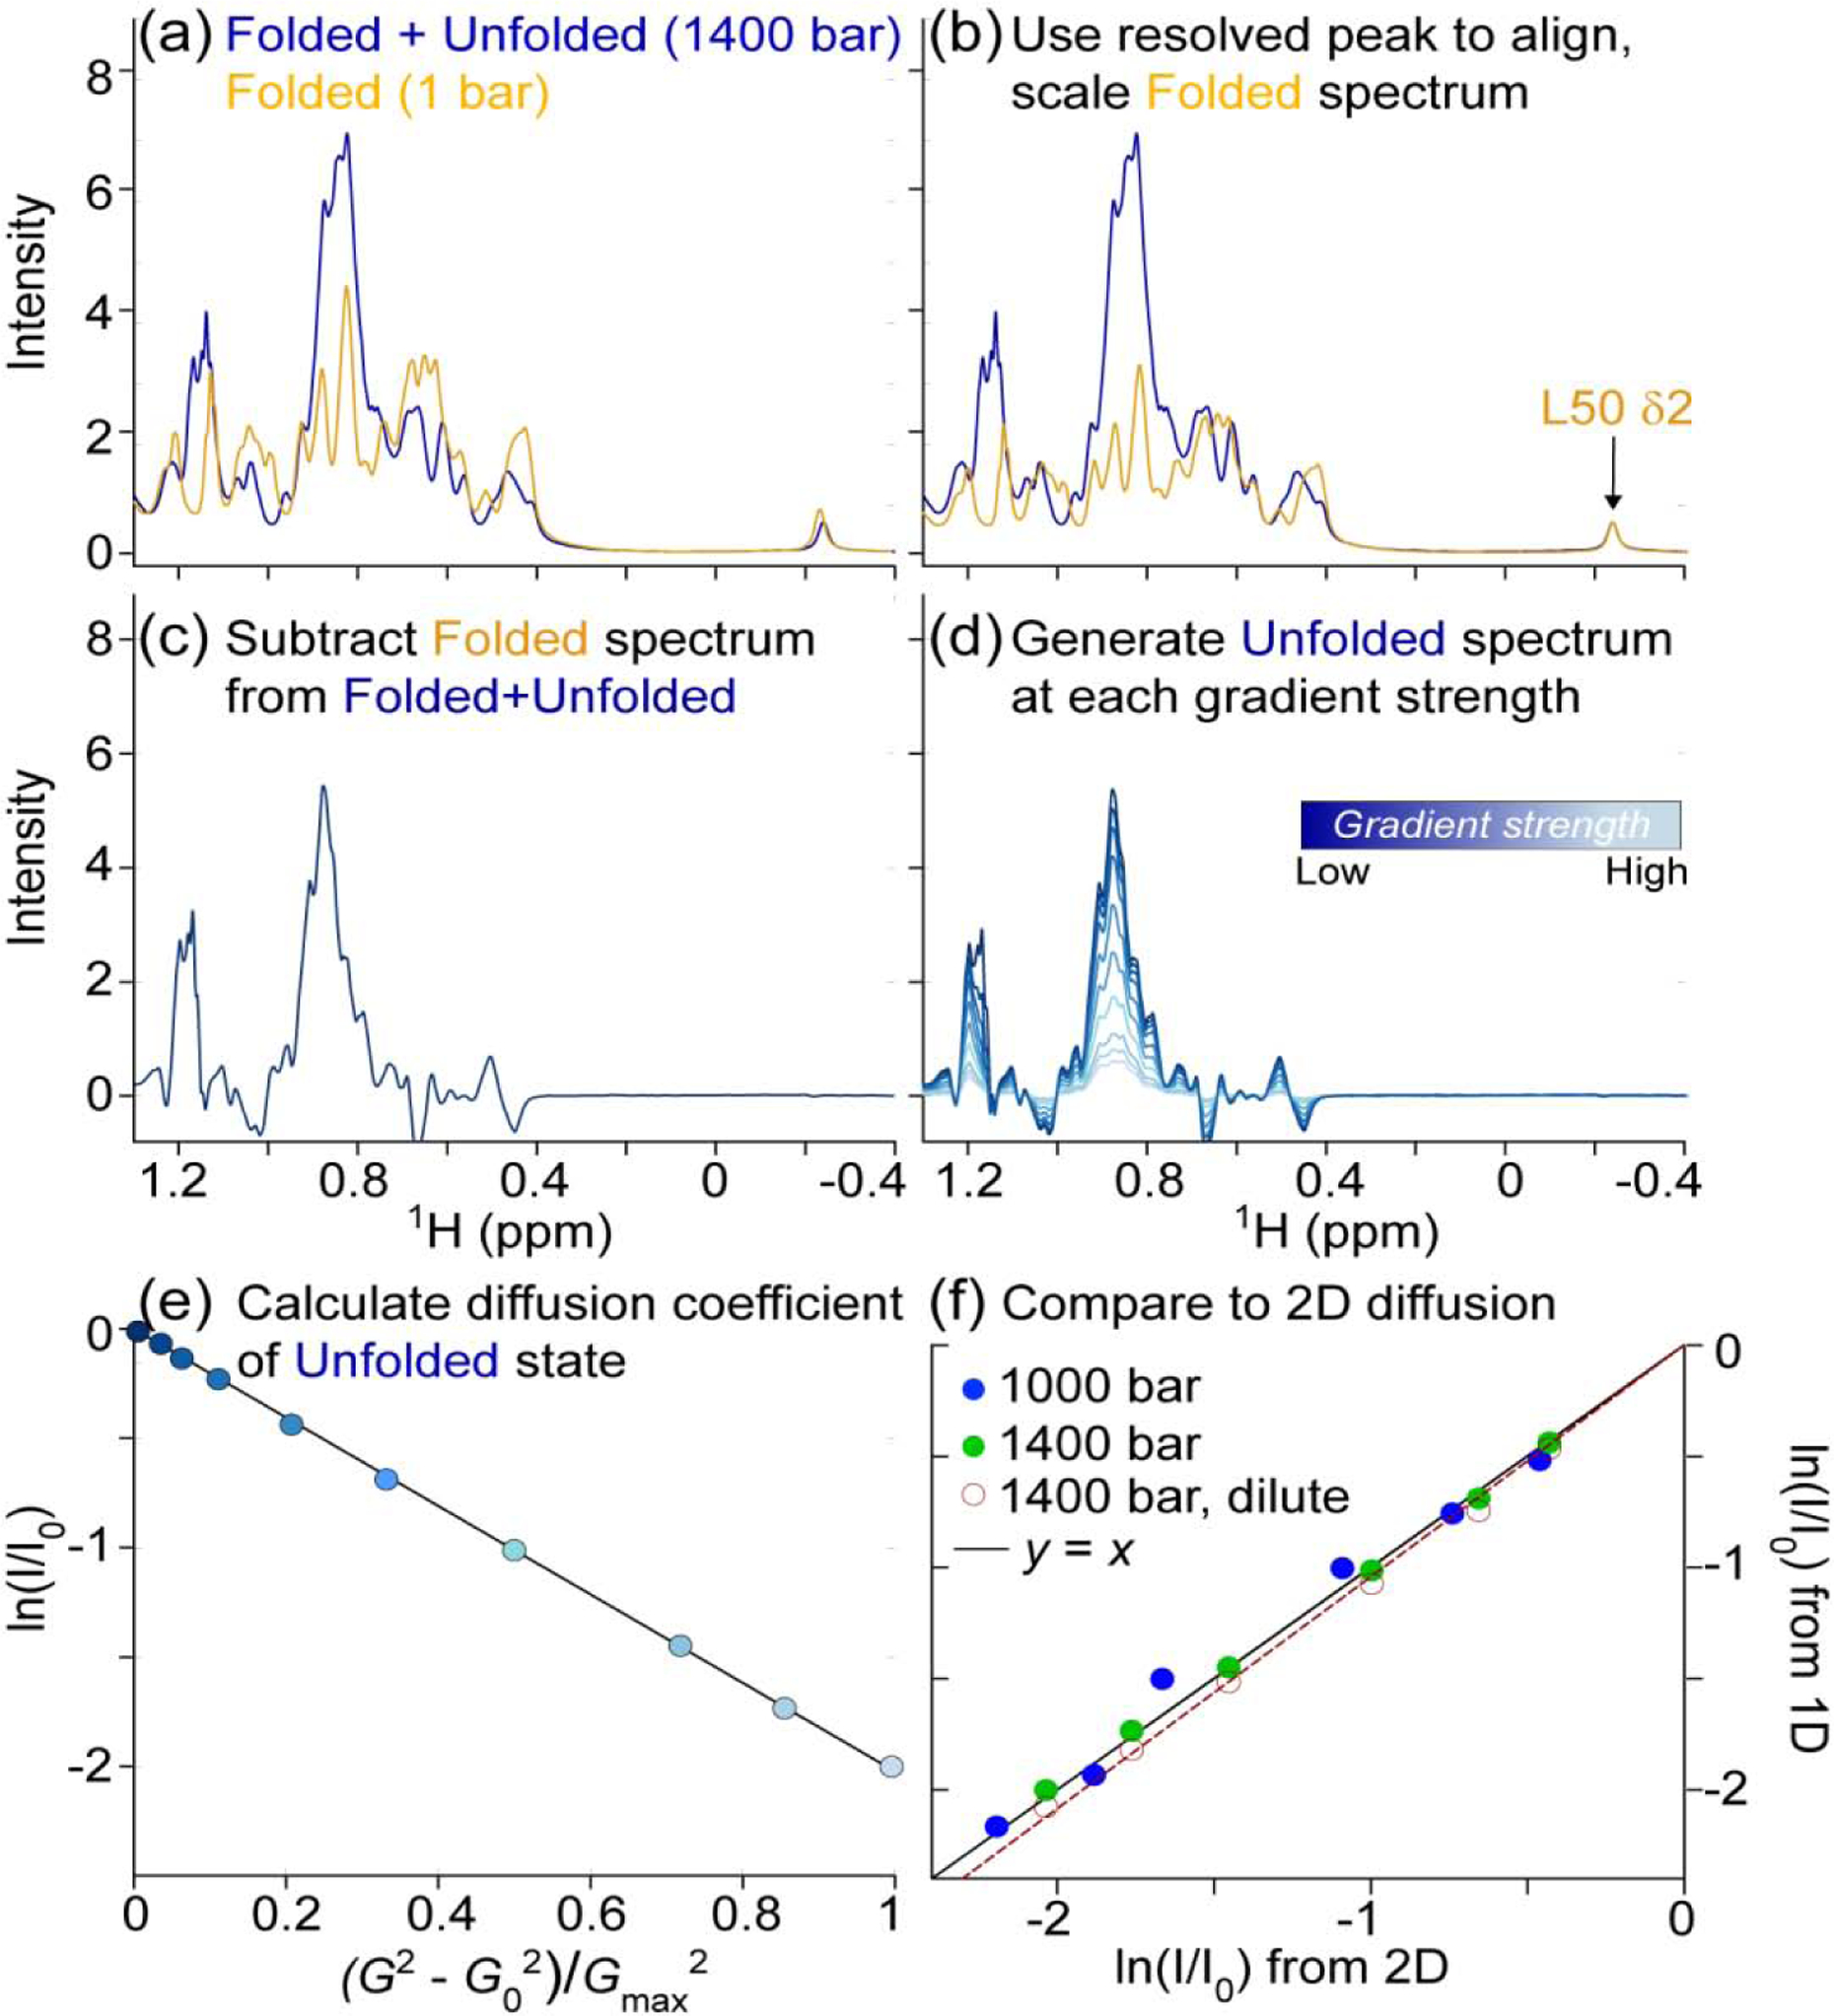
Fig. 4.

Translational diffusion measurement of unfolded VA2-ubiquitin in 94% H2O. Total protein concentration is 1.3 mM, pH 6.4. (a) The 1D NMR spectrum at 1400 bar (blue) contains signals from both folded and unfolded protein. The L50 Cδ2H3 resonance at −0.25 ppm serves as a reference for the folded protein spectrum (orange). (b) The spectrum of the folded state (1 bar) is aligned and scaled such that L50 Cδ2H3 matches that of the partially unfolded sample. (c) Subtraction of the scaled, folded spectrum then yields an artificial spectrum of the unfolded state. (d) Repeating the procedure for spectra generated at different gradient strengths yields the series of 1D spectra for which integrals over the methyl region are obtained. (e) Plot of the natural logarithm of the integrated methyl resonance intensity, ln(I/I0), at 1400 bar as a function of the squared gradient strength. G0 = 2.2 G/cm; Gmax = 33.4 G/cm. (f) A correlation plot showing the agreement between ln(I/I0) values derived from the unfolded state in 2D PFG NMR diffusion data set (x-axis) and those determined from the 1D method outlined above (y-axis). The I/I0 values from the 1D method were obtained through integration of the 1H chemical shift region between 0.80 and 0.94 ppm after reconstruction of the spectra of the unfolded state. I/I0 values from the 2D diffusion datasets were obtained by summing the intensities of N = 12 unfolded resonances at each gradient strength. Data collected at 1000 bar (blue) and 1400 bar (green) are presented, both at 1.3 mM total protein, and the solid line corresponds to y = x. The empty red circles are from a dilute sample (120 μM total) at 1400 bar and the best-fitted diffusion rate of the 120 μM sample is 5% faster than for the 1.3 mM sample (dashed red line).
