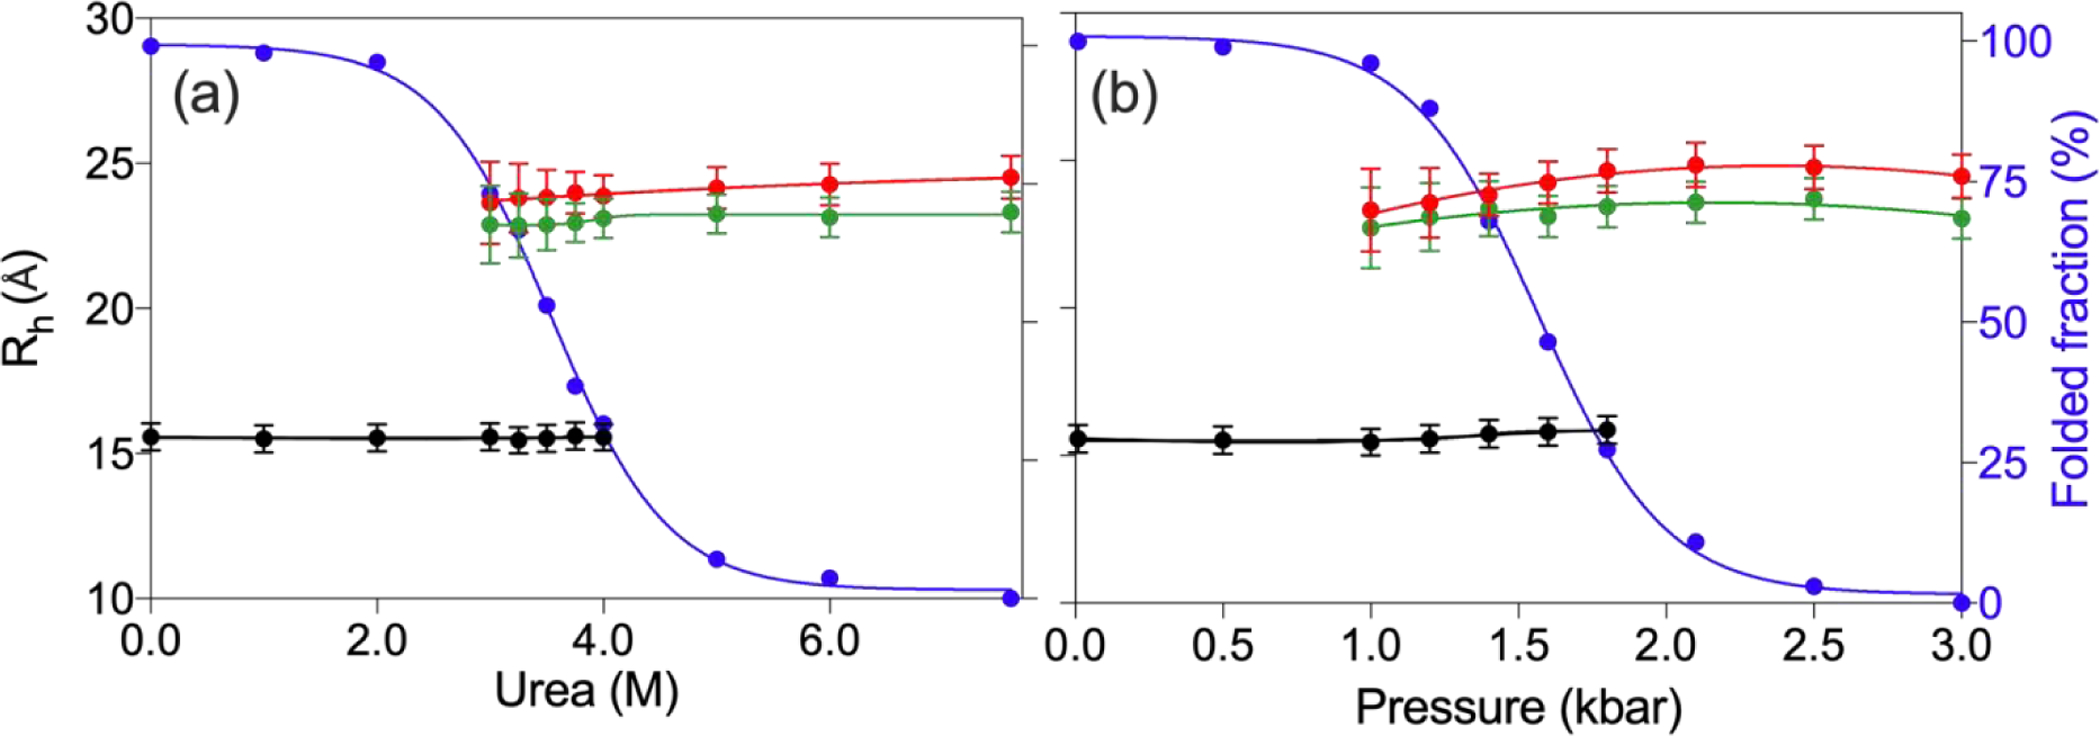
Fig. 5.

Rh of folded (black) and unfolded (red/green) VA2-ubiquitin under a range of denaturing conditions. (a) Rh values as a function of urea concentration and (b) as a function of hydrostatic pressure. Red and green symbols correspond to high (0.7 mM for urea denaturation; 1.3 mM for pressure unfolding) and dilute (0.1 mM) total protein concentration, respectively. Black symbols correspond to the diffusion of the folded protein at the higher concentration and values are within experimental error from diffusion rates measured at 0.1 mM concentration. Blue symbols correspond to the fraction of folded population. Solvent viscosity as a function of urea concentration for the samples of panel (a), as reflected in the diffusion rate of dioxane, are shown in Fig. S8.
