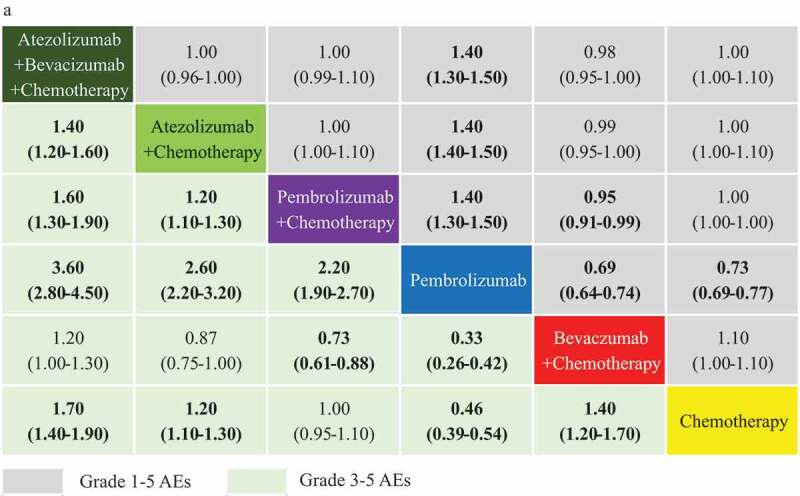
Figure 6.

Incidence of grade 1–5 AEs and grade ≥3 AEs comparative profiles according to network meta-analysis (NMA). Each cell contains the pooled odds ratios (OR) and 95% credibility intervals for the incidence of AEs; significant results are emboldened. AEs: adverse events AE.
