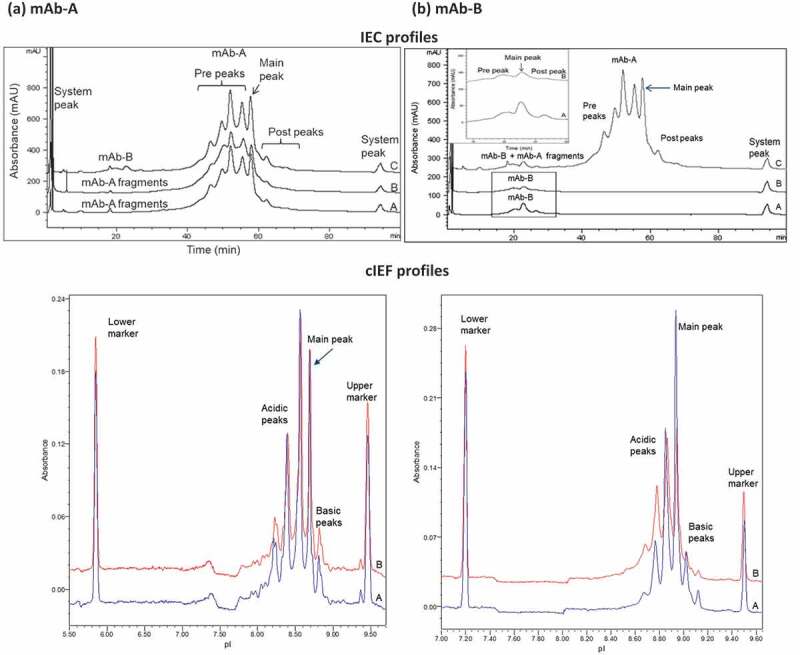
Figure 3.

Comparison of charge variant profiles for (a) mAb-A and (b) mAb-B. Profiles A, mAb-A and mAb-B; profiles B, mAb-A and mAb-B fractionated by HIC from COMBO; profiles C, Combo by IEC and cIEF. Rectangular area is magnified in inset of (b) IEC profiles.
