
Figure 5.
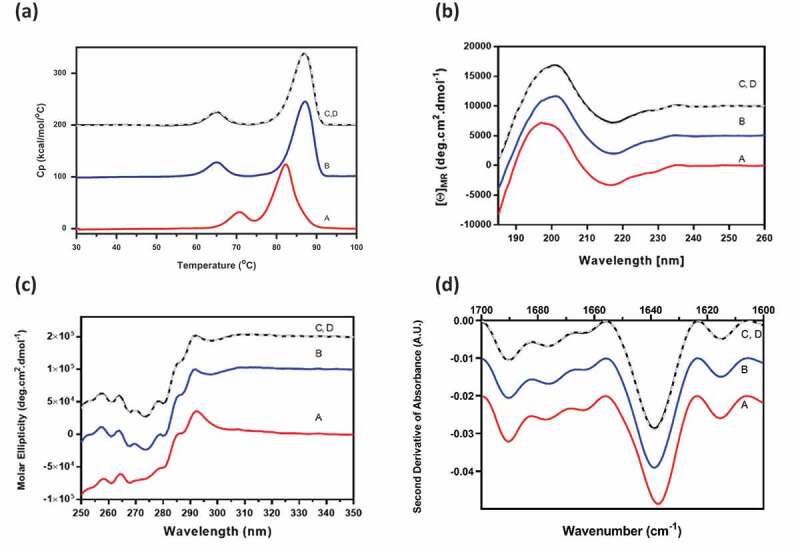
Higher-order structure profiles of experimental mAb-B and mAb-A, Combo, and reconstructed Combo by (a) DSC, (b) far UV CD, (c) near UV CD, and (d) FTIR. Profile A, mAb-B (red); profile B, mAb-A (blue); profile C, experimental Combo (black); profile D, reconstructed Combo (gray).