
Figure 6.
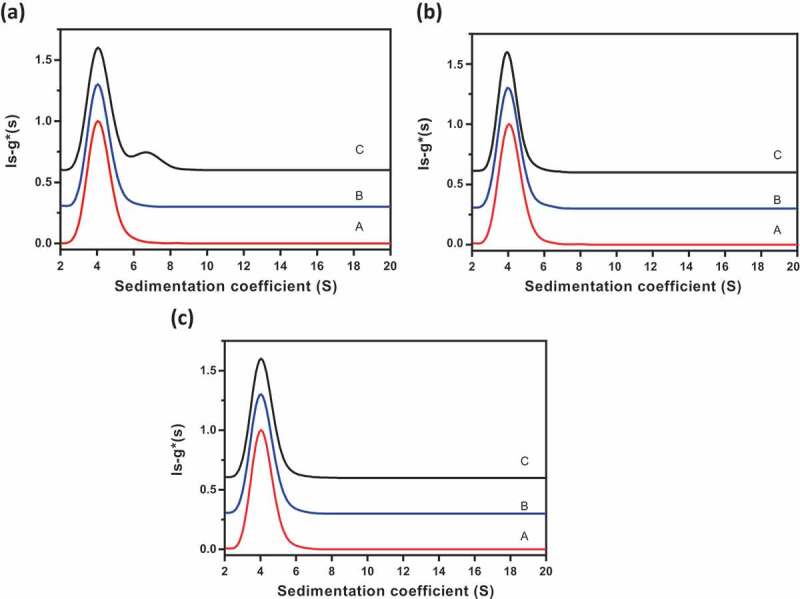
AUC profiles for evaluating intermolecular interactions of mAb-A and mAb-B in Combo. (a) Comparison of AUC profiles of mAb-A, Combo, and a positive control of intermolecular interactions (a:b mixtures of mAb-A and anti-mAb-A antibody). Profile A, mAb-A (red); profile B, Combo (blue); profile C, positive control (a:b mixtures of mAb-A and anti-mAb-A antibody; black). (b) Impact of Combo concentration on ls-g*(s) sedimentation profile. Profile A, Combo at 0.2 mg/mL (red); profile B, Combo at 0.5 mg/mL (blue); profile C, Combo at 2 mg/mL (black). (c) Impact of mAb-A:mAb-B ratio on ls-g*(s) sedimentation profile. Profile A, a:b mixture of mAb-A and mAb-B (red); profile B, 4:1 mixture of mAb-A and mAb-B (blue); profile C, 1:1 mixture of mAb-A and mAb-B (black).