
Figure 2.
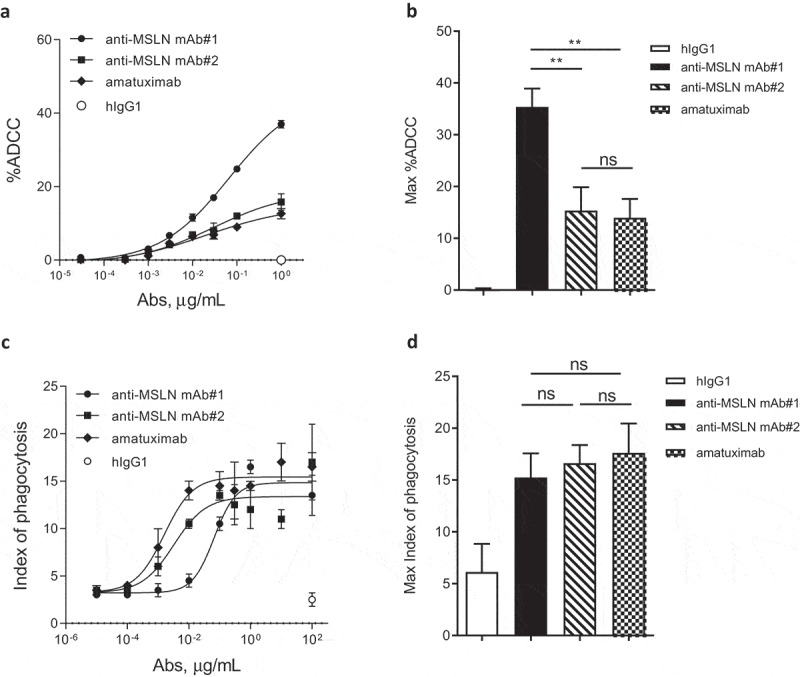
The anti-MSLN Ab targeting a membrane-proximal region showed more efficient killing through ADCC but not by ADCP as compared to Abs targeting more membrane-distal region. (a) %ADCC mediated by a fixed dose of hIgG1 isotype control (e.g., 1 μg/mL) or a dose range (0.03 ng/mL – 1 μg/mL) of anti-MSLN mAb#1, mAb#2, or amatuximab using NCI-N87 cells as targets. The graph depicts an example of a dose–response curve tested in duplicate. (b) The graph summarizes the mean of the %ADCC ± SEM mediated by anti-MSLN mAbs or hIgG1 isotype control (all tested at 1 μg/mL) of 3 independent experiments using different donors as a source of effector cells. (c) ADCP of NCI-N87 target cells with a fixed concentration of hIgG1 isotype control (e.g., 100 μg/mL) or a dose–response of anti-MSLN mAb#1, mAb#2, or amatuximab (0.01 ng/mL – 100 μg/mL). The graph depicts a representative ADCP curve obtained and tested in triplicate. Data are presented as an index of phagocytosis defined as the number of target cells engulfed per 100 macrophages. (d) The graph depicts the maximum index of phagocytosis (e.g., obtained at 10 μg/mL) ± SEM mediated by anti-MSLN mAbs or hIgG1 isotype control (all tested at 10 μg/mL) of 4 independent experiments using different donors as a source of macrophages. Statistical analysis was performed using the unpaired T-test: **p < .01, ns = not significant.