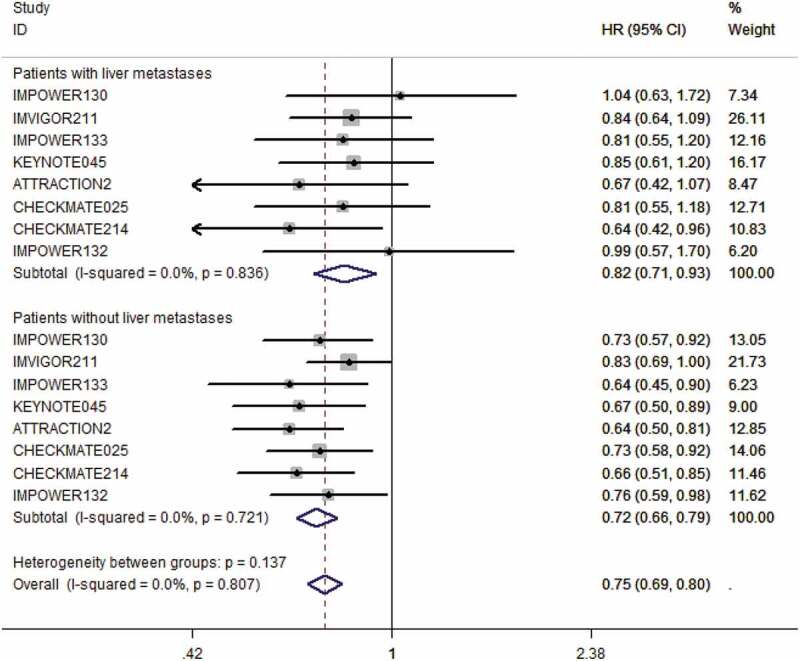
Figure 2.

The forest plot of the hazard ratios and 95% CI of death in both groups of patients with LM and without LM assigned to intervention treatment, compared with those in the control groups. The pooled HR was calculated by fixed-effects model since no heterogeneity was found in both groups. The difference between these two groups was not significant (P = .137).
