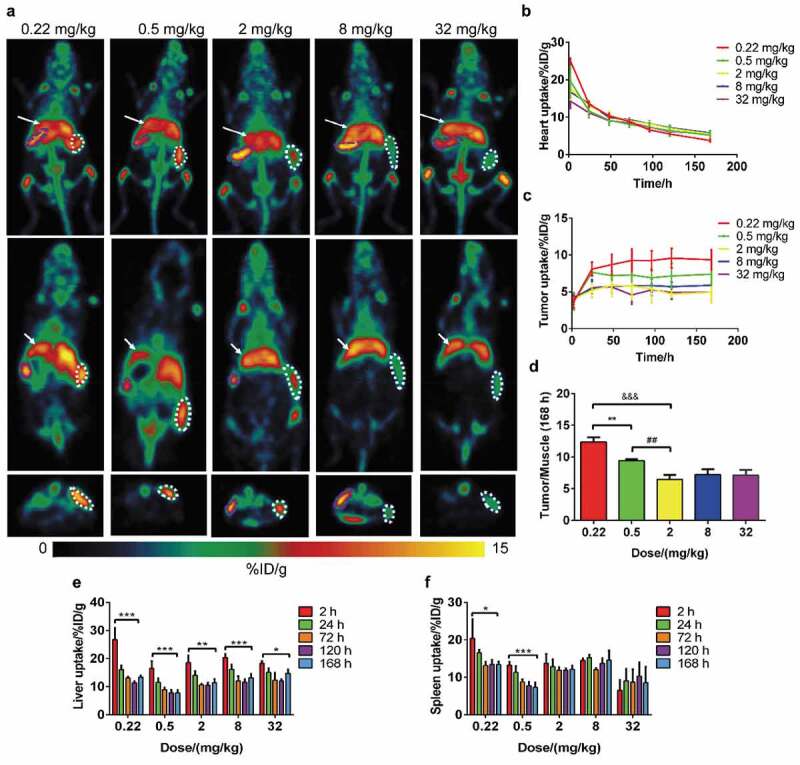
Figure 1.

Results of dose escalation PET imaging with 89Zr-labeled IBI322. Maximum intensity projections (MIPs) of a humanized transgenic mouse (B-hCD47; genotype: h/h) bearing an MC38 tumor (hCD47 and hPDL1) (above) and coronal (middle) and transverse (below) tomograms of the tumor at 168 h. The white arrow indicates the ROI of the liver, the white dotted line indicates the ROI of the tumor, and the purple dotted line indicates the ROI of the spleen (a). Images are parameterized as %ID/g. Time-activity curves of the heart (b) and tumor (c) for each group. (d) The tumor/muscle ratios of each group at 168 h. **: p < .01, group 1 vs group 2, ##: p < .01, group 2 vs group 3, &&&: p < .001, group 1 vs group 3. Histograms of liver (e) and spleen (f) uptake for each group. *: p < .05, 2 h vs 168 h, **: p < .01, 2 h vs 168 h, ***: p < .001, 2 h vs 168 h.
