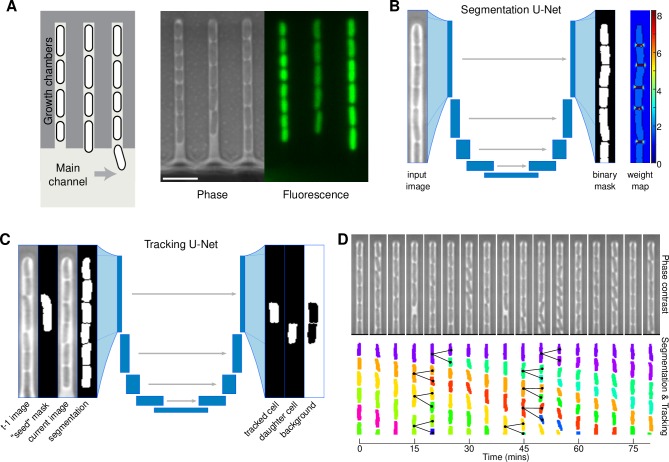
Fig 1. Core elements of the DeLTA pipeline and segmentation and tracking results.
(A) Schematic representation of mother machine device. Mother cells are trapped at one end of the chamber and their progeny are progressively flushed out of the chamber, into the main nutrient flow channel. Fluorescent reporters can be used to monitor single-cell gene expression. Scale bar is 5μm in length. (B) Inputs and outputs of the segmentation U-Net. Note that the weight maps are only used for training and are not produced at the prediction step. (C) Inputs and outputs for the tracking U-Net. (D) Representative kymograph of segmentation and tracking for a single chamber. Black lines highlight detected divisions and mother-daughter relationships.

