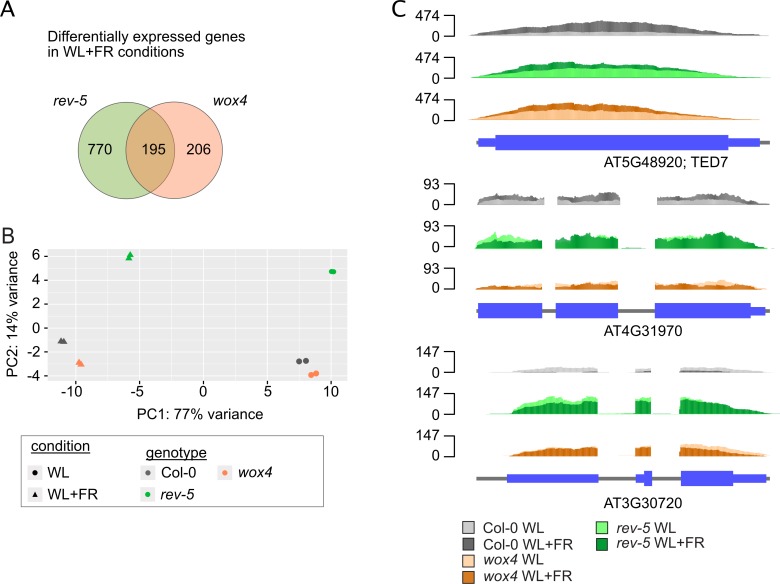
Fig 5. Shade-induced transcriptome changes in vascular patterning mutants.
A, Venn diagram depicting differentially expressed genes (DEGs) in response to shade in the different genetic backgrounds (log2FC > +1/-1, BH-adj. p-value < 0.01). B, Principle component analysis of the gene expression (regularized logarithm transformed count data) between the different RNA-seq libraries. Plotted is the percentage of variance for each component. C, RNA-Seq read coverages of representative candidate genes showing the expression levels in the different genetic backgrounds. Upper panel shows a gene (AT5G48920; TED7) that is expressed at higher levels in WL in rev-5 and wox4; the middle panel depicts a gene (AT4G31970) that is more robustly expressed in rev-5 and much lower in wox4 while the lower panel depicts a gene (AT3G30720) that is higher expressed in the mutant plants compared to wild type.

