Figure 1.
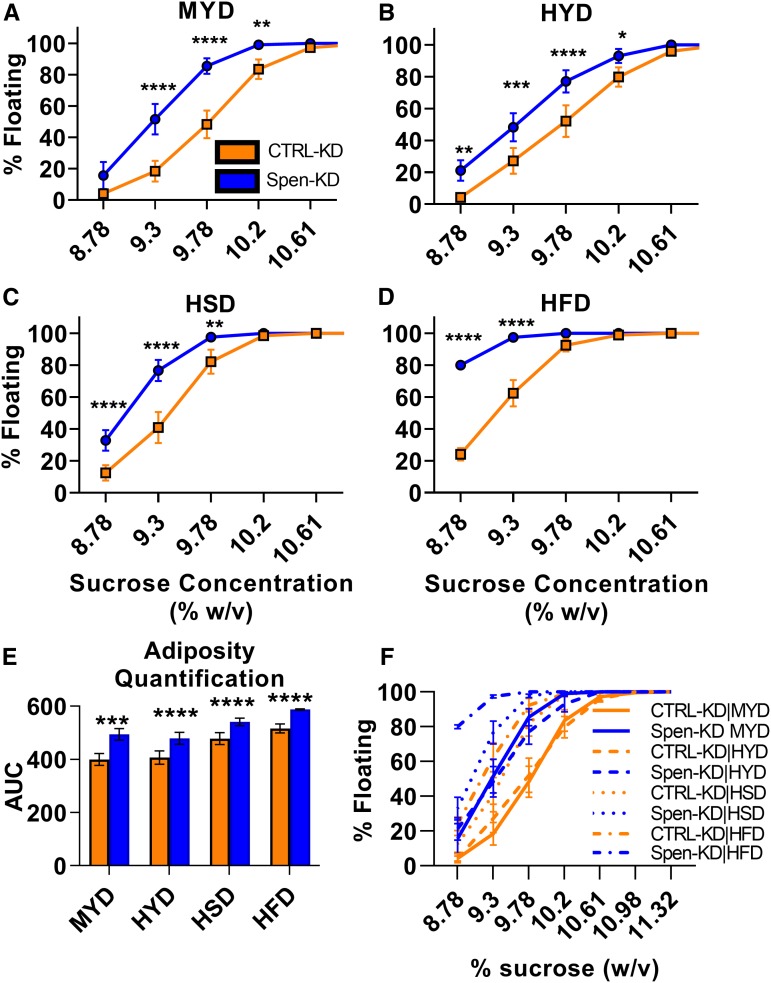
Dietary intervention affects the adiposity phenotype of Spen-KD. Buoyancy assays were performed on third instar wandering larvae. (A) The percent of floating larvae at different sucrose densities (percent weight/volume) of FB-specific Spen KD (Spen-KD, blue) compared to control KD (CTRL-KD, orange) reared on the control MYD. (B) As in Figure 1A, Spen-KD buoyancy compared to CTRL-KD across a sucrose gradient with larvae reared on HYD, (C) reared on HSD, and (D) reared on HFD. Two-way ANOVA compared CTRL-KD to Spen-KD buoyancy at increasing sucrose concentration; *P < 0.05, **P < 0.01, ***P < 0.001, ****P < 0.0001. (E) Quantification of the buoyancy curves by integrating the area under the curve (AUC) represented as arbitrary units (A.U.). (F) The data from A–D combined in one plot. Comparison by two-way ANOVA (***P < 0.001, ****P < 0.0001). Error bars represent SEM. n = 5 replicates, 50 larvae per replicate.

