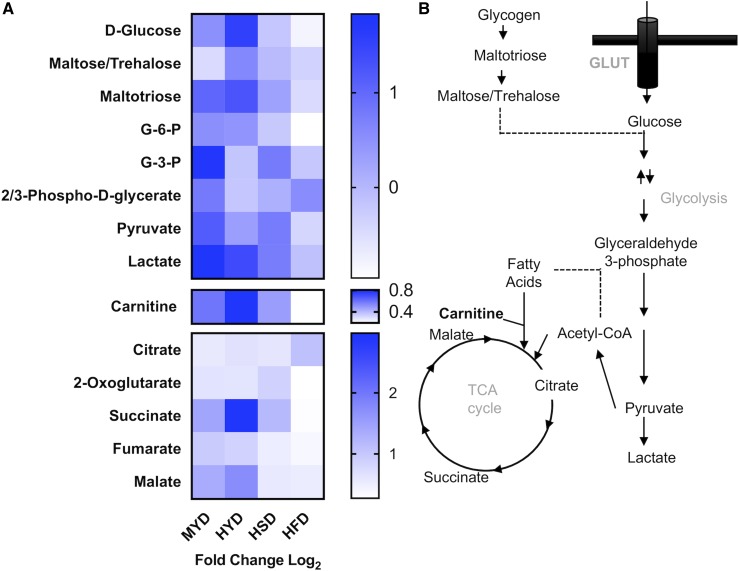
Figure 4.
HYD rescues L-carnitine levels in Spen-KD. (A) Heat map of glycolytic metabolites, L-carnitine, and the citric acid cycle (TCA cycle) metabolites, showing differences between Spen-KD and CTRL-KD on matched diet. MYD, HYD, HSD, and HFD. Heat map shows log2 fold change in metabolite abundance. Carnitine is an essential carrier for fatty acids into the mitochondrial matrix to facilitate β-oxidation of lipids as TCA cycle inputs. (B) Schematic summary of metabolite flux through the metabolic pathways analyzed in the heat map. n = 3 replicates, 10 individual larvae per replicate per genotype per diet (30 measurements per genotype|diet). G-3-P, glyceraldehyde 3-phosphate; G-6-P, glucose 6-phosphate.

