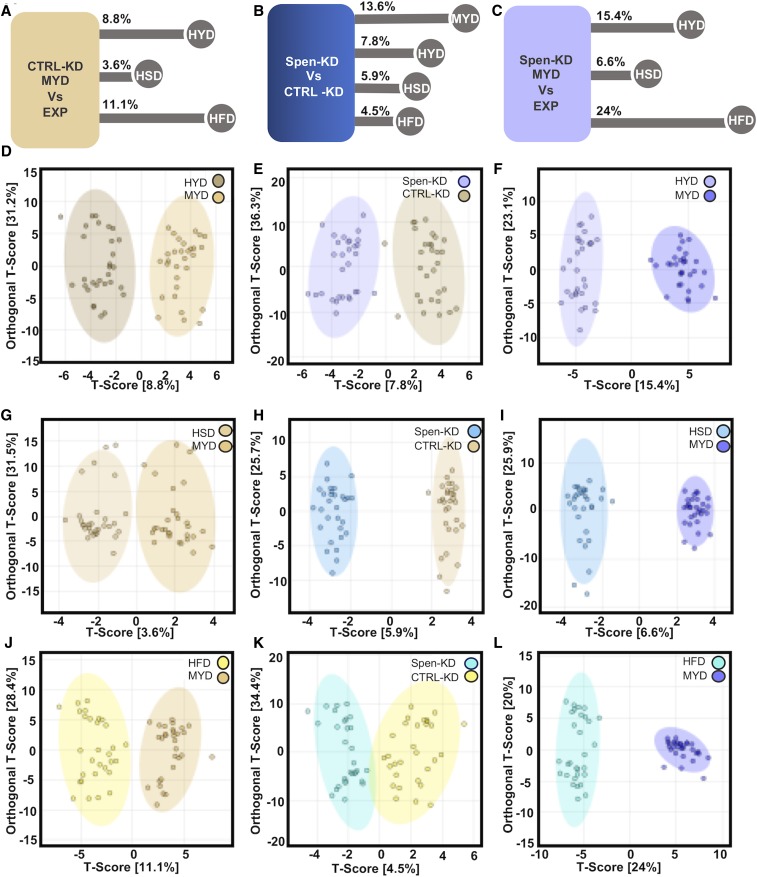
Figure 6.
OLPS-DA comparisons of genotypes on diets and between genotypes. (A) The metabolite differences (as percentage of all metabolites assayed) between CTRL-KD|MYD and CTRL-KD|EXP. (D, G, and J) OLPS-DA of CTRL-KD|MYD compared to (D) HYD, (G) HSD, and (J) HFD. (B) Metabolite profile differences between Spen-KD and CTRL-KD on control MYD diet. (E, H, and K) OLPS-DA of CTRL-KD (yellow) and Spen-KD (blue) on (E) HYD, (H) HSD, and (K) HFD. (C) Metabolite differences between Spen-KD|MYD and Spen-KD|EXP. (F, I, and L) OLPS-DA of Spen-KD|MYD compared to Spen-KD| (F) HYD, (I) HSD, and (L) HFD. T-score: variation between groups. Orthogonal T-score: variation within the group. n = 3 replicates, 10 individual larvae per replicate per genotype per diet (30 measurements per genotype|diet).

