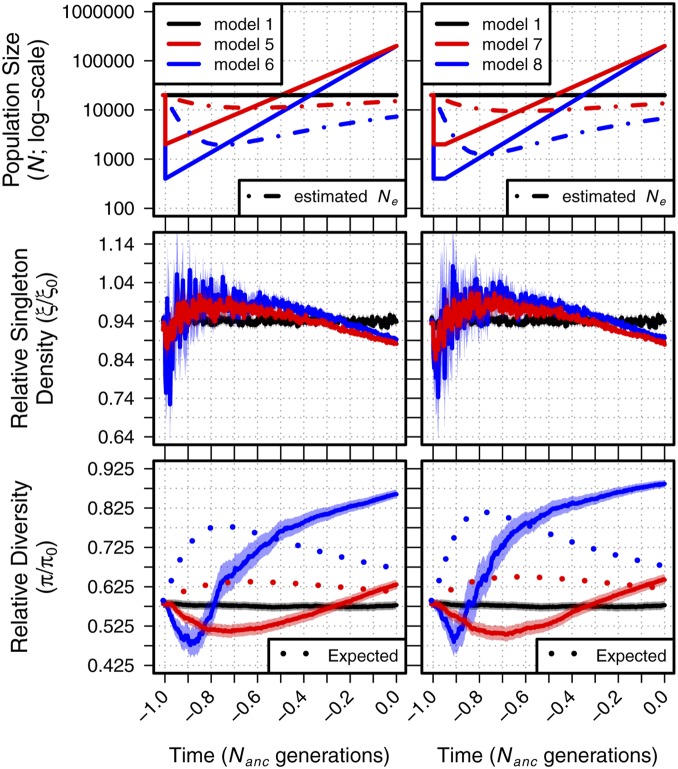
Figure 3.
Relative singleton density and relative diversity across time for demographic models 1 and 5–8. The top panel shows each demographic model; time proceeds forward from left to right and is scaled by the N of the population at the initial generation (; 20,000 individuals). Dot-dashed lines in the top panels show the estimated from observed . Dotted lines in the bottom panel show the equilibrium expectation of from a log-linear model of simulated background selection with the specific selection parameters and the estimated at each time point (see Figure S3). Envelopes are 95% CIs calculated from 10,000 bootstraps of the original simulation data.

