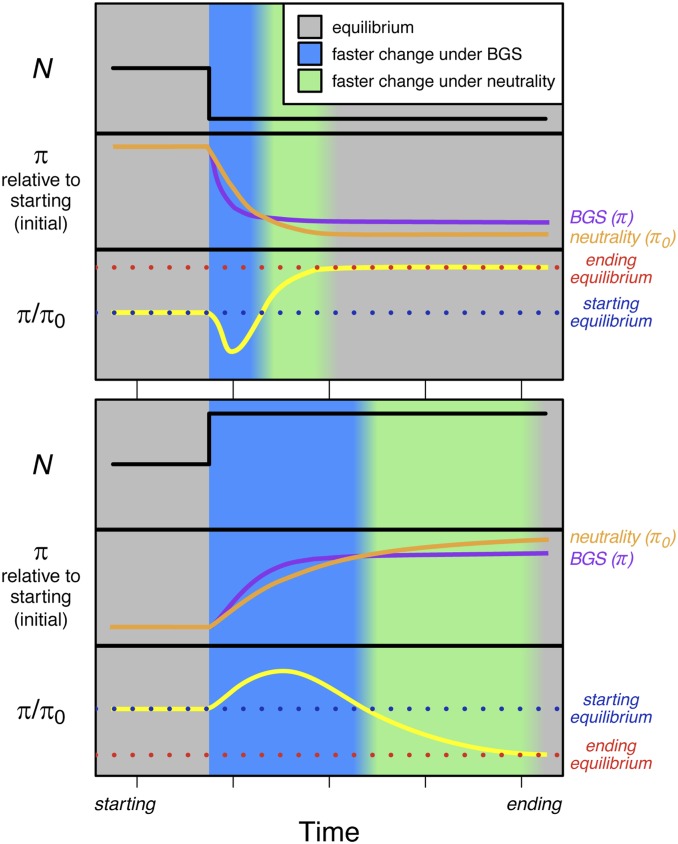
Figure 5.
Schematic of the temporal dynamics of diversity under neutrality (; orange lines) and BGS (π; violet lines) for a demographic bottleneck and an expansion. Relative diversity (; yellow lines) is shown in the bottom section of each figure panel, with equilibrium points before demographic change (blue dotted lines) and after demographic change (red dotted lines) shown. Background colors represent epochs of time where the change in diversity is faster under BGS (blue) or neutrality (green). BGS, background selection.

