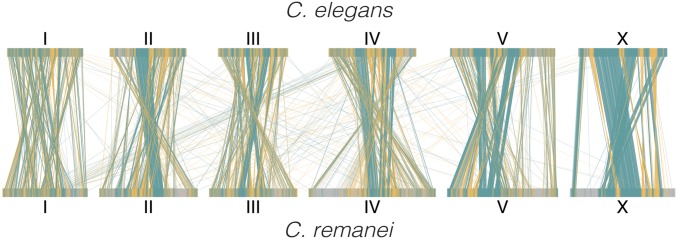
Figure 1.
Gene synteny plot of the 9247 one-to-one orthologs of C. elegans (the top row) and C. remanei (the bottom row). The lines connect locations of the orthologs on the C. elegans and C. remanei reference genomes. Teal lines represent genes in the same orientation, whereas orange lines show genes in an inverted orientation.

