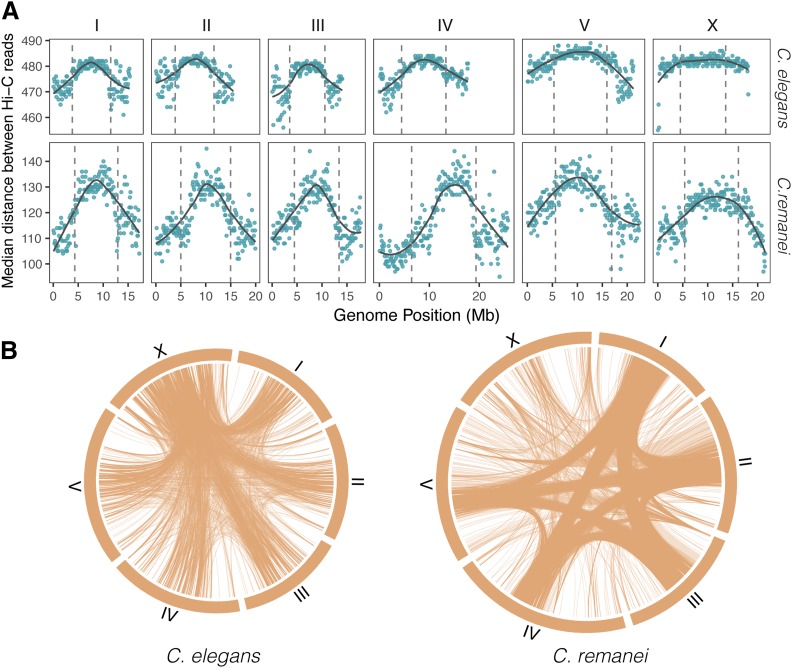
Figure 3.
Genome landscape of median distances in Hi-C read pairs in C. elegans and C. remanei samples. (A) Distributions of distances between paired reads of cis-chromosome interactions. The vertical dashed lines show the boundaries of the central domain. Medians are estimated per 100-kb windows, with the gray lines representing the smoothed means of the values. The differences between values for C. elegans and C. remanei are due to the library size selection for Illumina sequencing in these two Hi-C experiments, and so only the relative patterns and not the absolute values are relevant here. (B) Trans-chromosome interactions in C. elegans and C. remanei. Lines represent contacts between 100-kb windows. For the C. elegans data set, only contacts with > 200 pairs of reads are shown; for the C. remanei data set, only contacts with > 100 pairs of reads are shown (the C. remanei Hi-C data set is two times smaller than the C. elegans data set). These filters emphasize differences in interaction density/location; the actual total number of interactions is approximately the same for all chromosomes.

