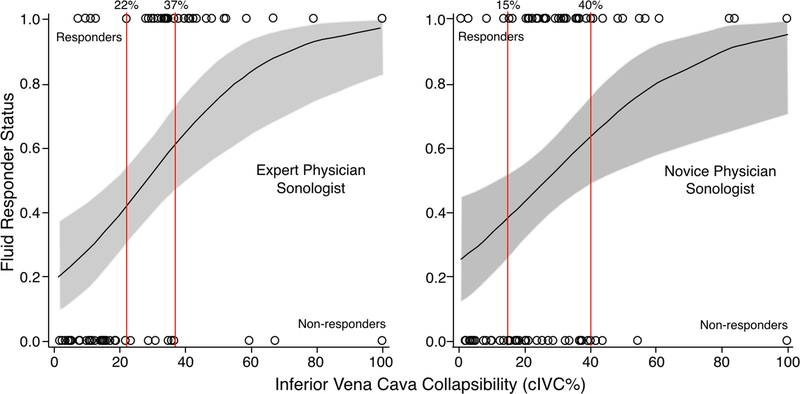
Figure #3:
Probability of a participant being a fluid responder using the cIVC cutoff value ranges, novice physician sonologists versus expert physician sonologist. The gray areas indicate the 95% confidence intervals for probability of being a fluid responder. The vertical red lines demarcate the cIVC cutoff range values. Circles represent individual participants who are fluid responders (top of graph) or non-responders (bottom of graph).

