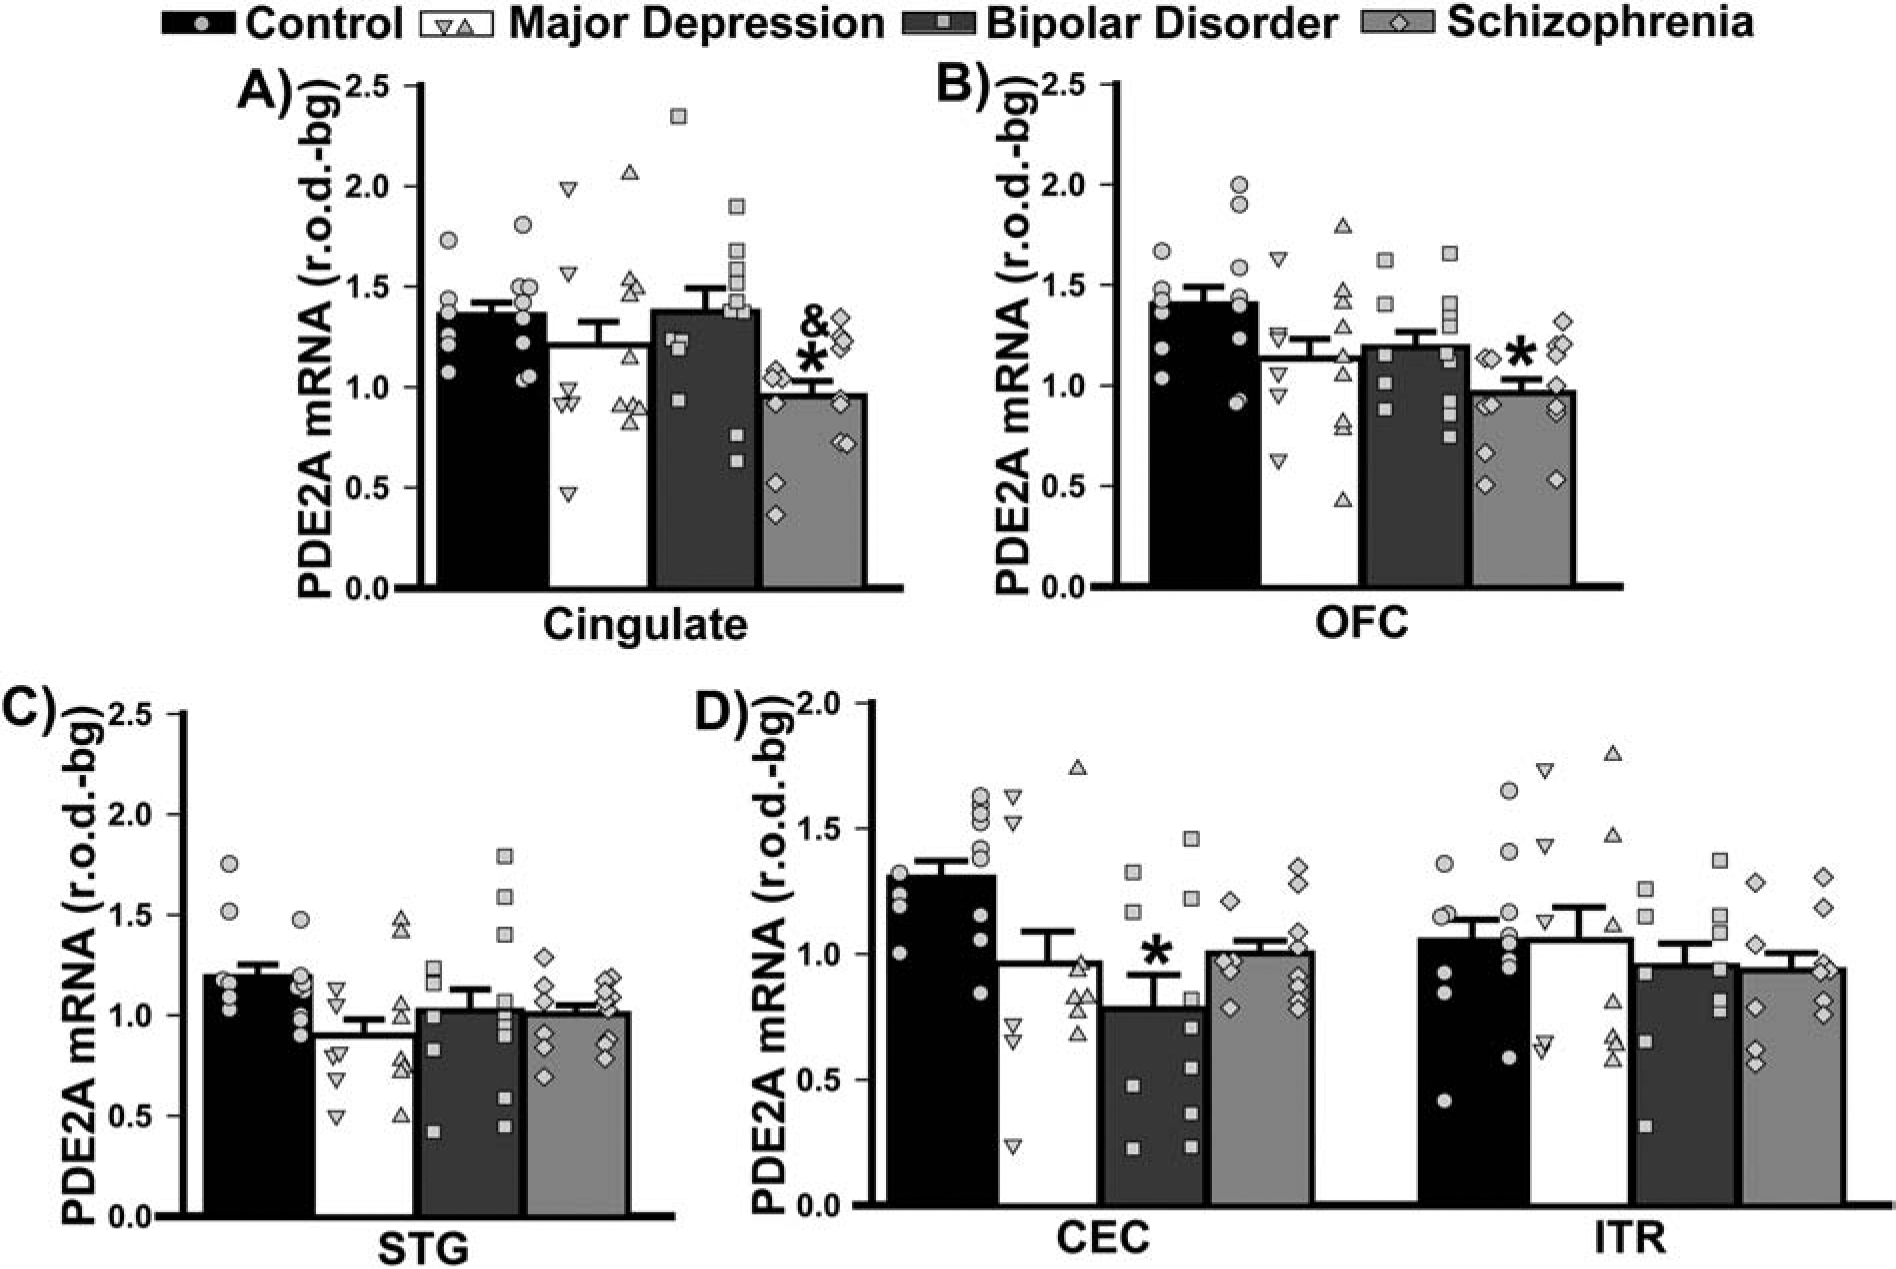
Figure 2. PDE2A mRNA expression in cortex of male and female patients with MDD, BPD, or SCZ.

Group averages are plotted as histograms (Data ±SEM) and overlaid with individual data points for each female (in the left column of each histogram bar) and male subject (in the right column). A) In cingulate cortex, patients with SCZ expressed significantly less PDE2A mRNA relative to controls and patients with BPD (F(3,53)=3.89, P=0.014; Post hoc: control vs. SCZ, P=0.015; BPD vs. SCZ, P=0.02. B) In orbitofrontal cortex (OFC), patients with SCZ expressed significantly less mRNA only relative to controls (F(3,53)=4.64, P=0.006; Post hoc: control vs. SCZ, P=0.003; vs. MDD, P=0.066; vs. BPD, P=0.08). C) In the superior temporal gyrus (STG), the effect of diagnosis did not reach the level of statistical significance (failed normality; H(3)=7.52, P=0.057). D) Among parahippocampal cortices, only the caudal entorhinal cortex (CEC) showed an effect of diagnosis (effect of diagnosis x brain region: F(3,42)=3.20, P=0.033), with patients with BPD exhibiting a significant reduction in PDE2A mRNA relative to controls (Post hoc, controls vs. BPD, P=0.013; vs. MDD, P=0.074; vs. SCZ P=0.053). *vs. Control, P=0.015–0.003; &vs. BPD, P=0.02.
