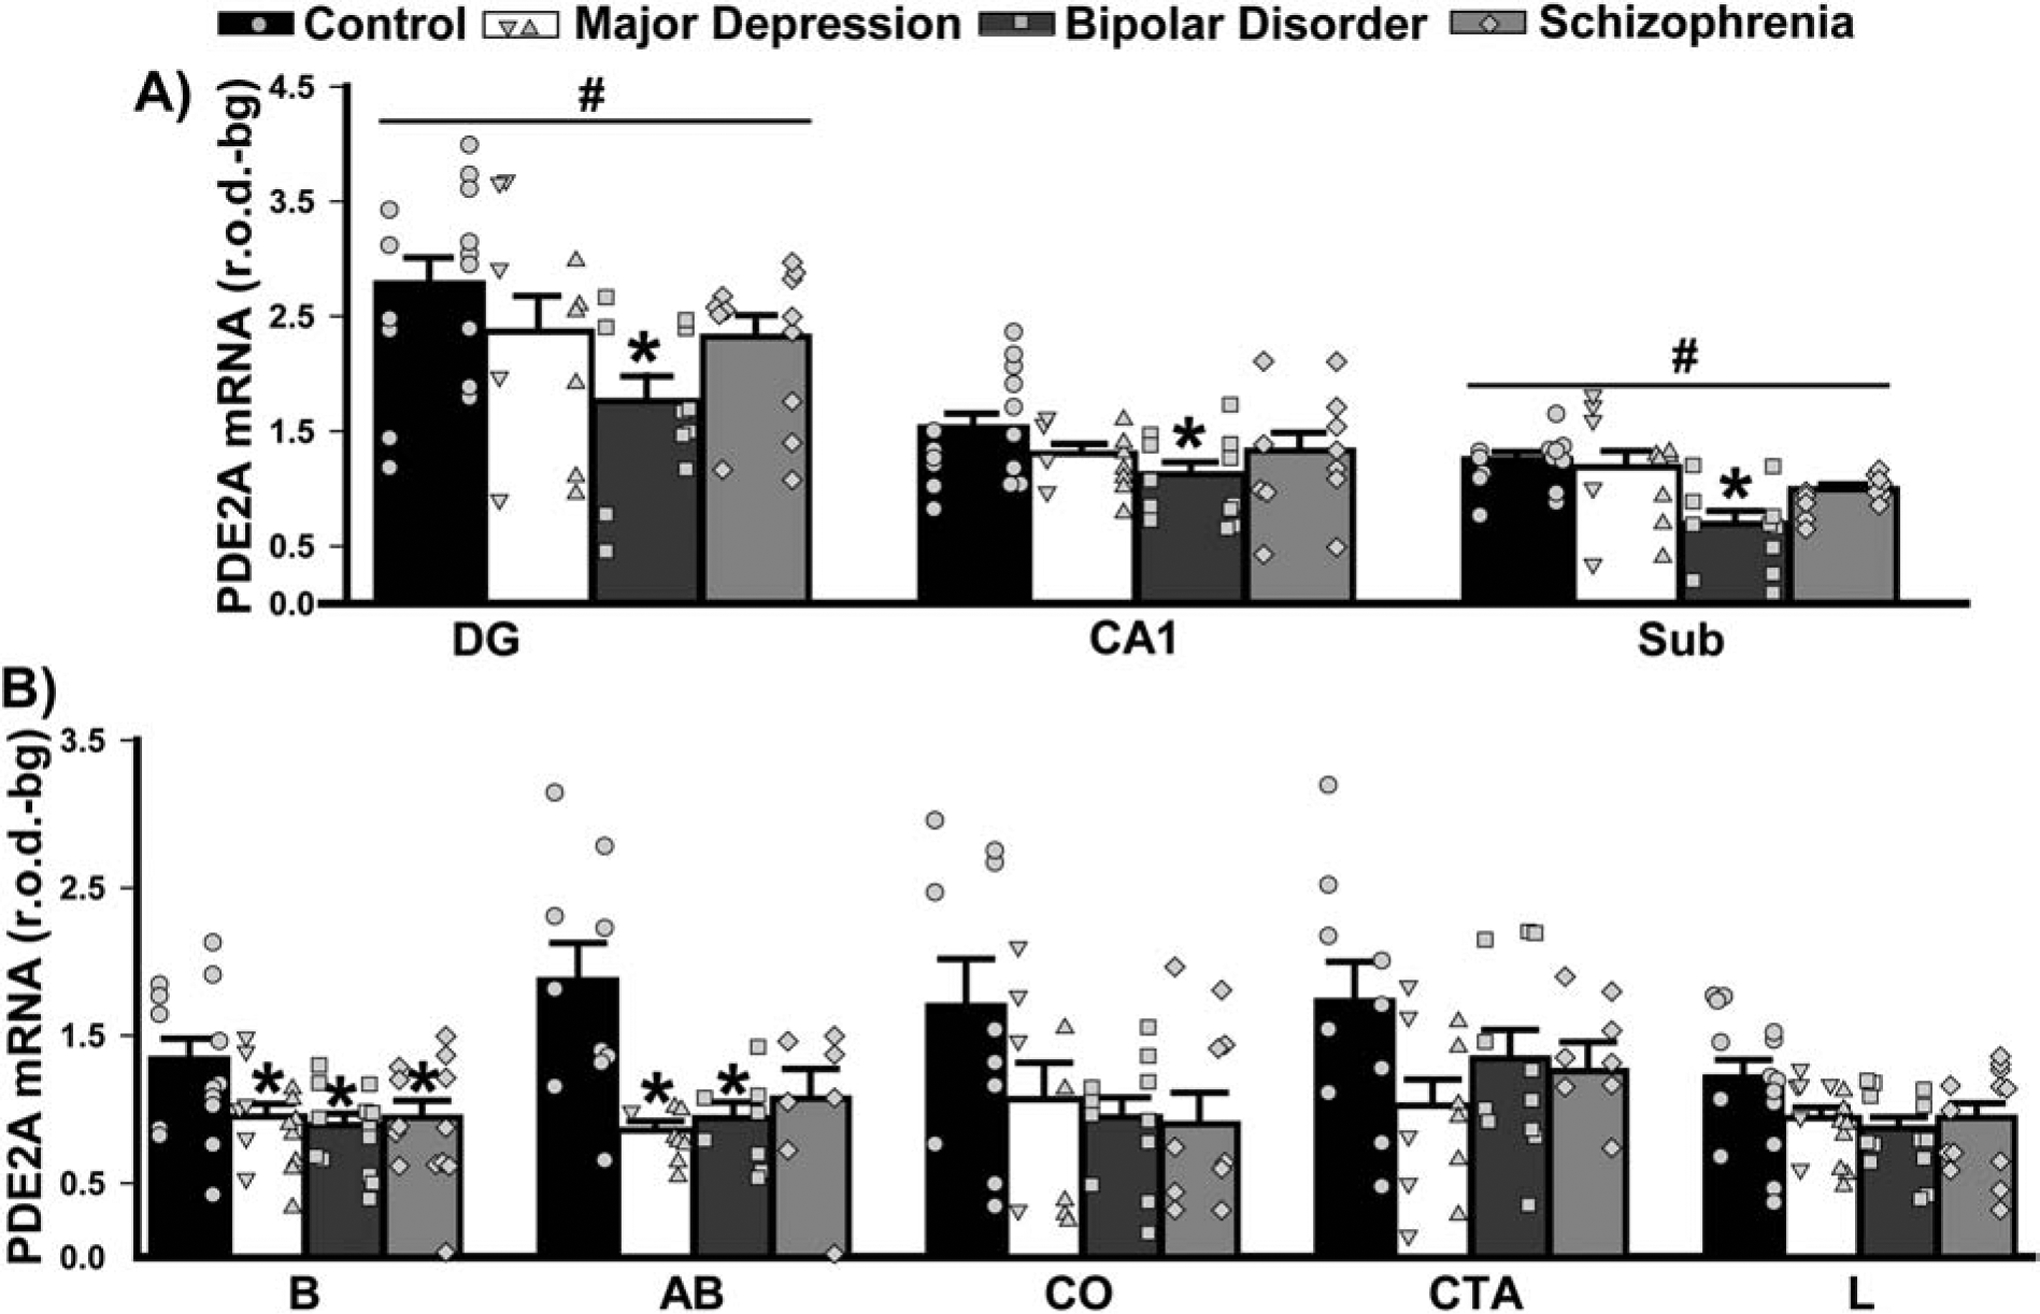
Figure 3. PDE2A mRNA expression in limbic regions of male and female patients with MDD, BPD, or SCZ.

Group averages are plotted as histograms (Data ±SEM) and overlaid with individual data points for each female (in the left column of each histogram bar) and male subject (in the right column). A) In the hippocampus, patients with BPD exhibited significantly reduced expression of PDE2A mRNA across all subfields vs. controls (main effect of diagnosis: F(3,88)=3.82, P=0.015; Post hoc: BPD vs. controls, P=0.01; vs. MDD, P=0.093; vs. SCZ, P=0.077). In addition, across groups, there was significantly increased expression in the dentate gyrus (DG) and significantly reduced expression in the subiculum relative to the other subfields (main effect of region: F(2,88)=130.07, P<0.0001; all other regions vs. DG, P=0.0001; vs. Sub, P=0.0005–0.0001). B) There was also an effect of diagnosis in select nuclei of the amygdala (2 Way RM ANOVA across nuclei failed normality, requiring individual ANOVAs and FDR correction of subsequent P-values). In nucleus basalis (B; F(3,50)=3.80, FDR-P=0.039), all patient groups had significantly reduced PDE2A mRNA expression relative to control subjects (Post hoc: Control vs. MDD, P=0.012; vs. BPD, P=0.024; vs. SCZ, P=0.032). In the basal accessory subnucleus (failed equal variance; H(3)=12.38, FDR-P=0.031), patients also showed reduced expression relative to controls (vs. MDD, P=0.008; vs. BPD, P=0.039). The decreased PDE2A expression noted in other regions did not reach statistical significance, including those in the corticalis nucleus (CO; F(3,37)=2.56, FDR-P=0.091), cortico-amygdalar transition area (CTA; F(3,37)=1.98, P=0.13) and lateral nucleus (L; F(3,51)=2.70, FDRP=0.068). *vs. Control, P=0.039–0.008; #vs. all other regions, P=0.0005–0.0001.
