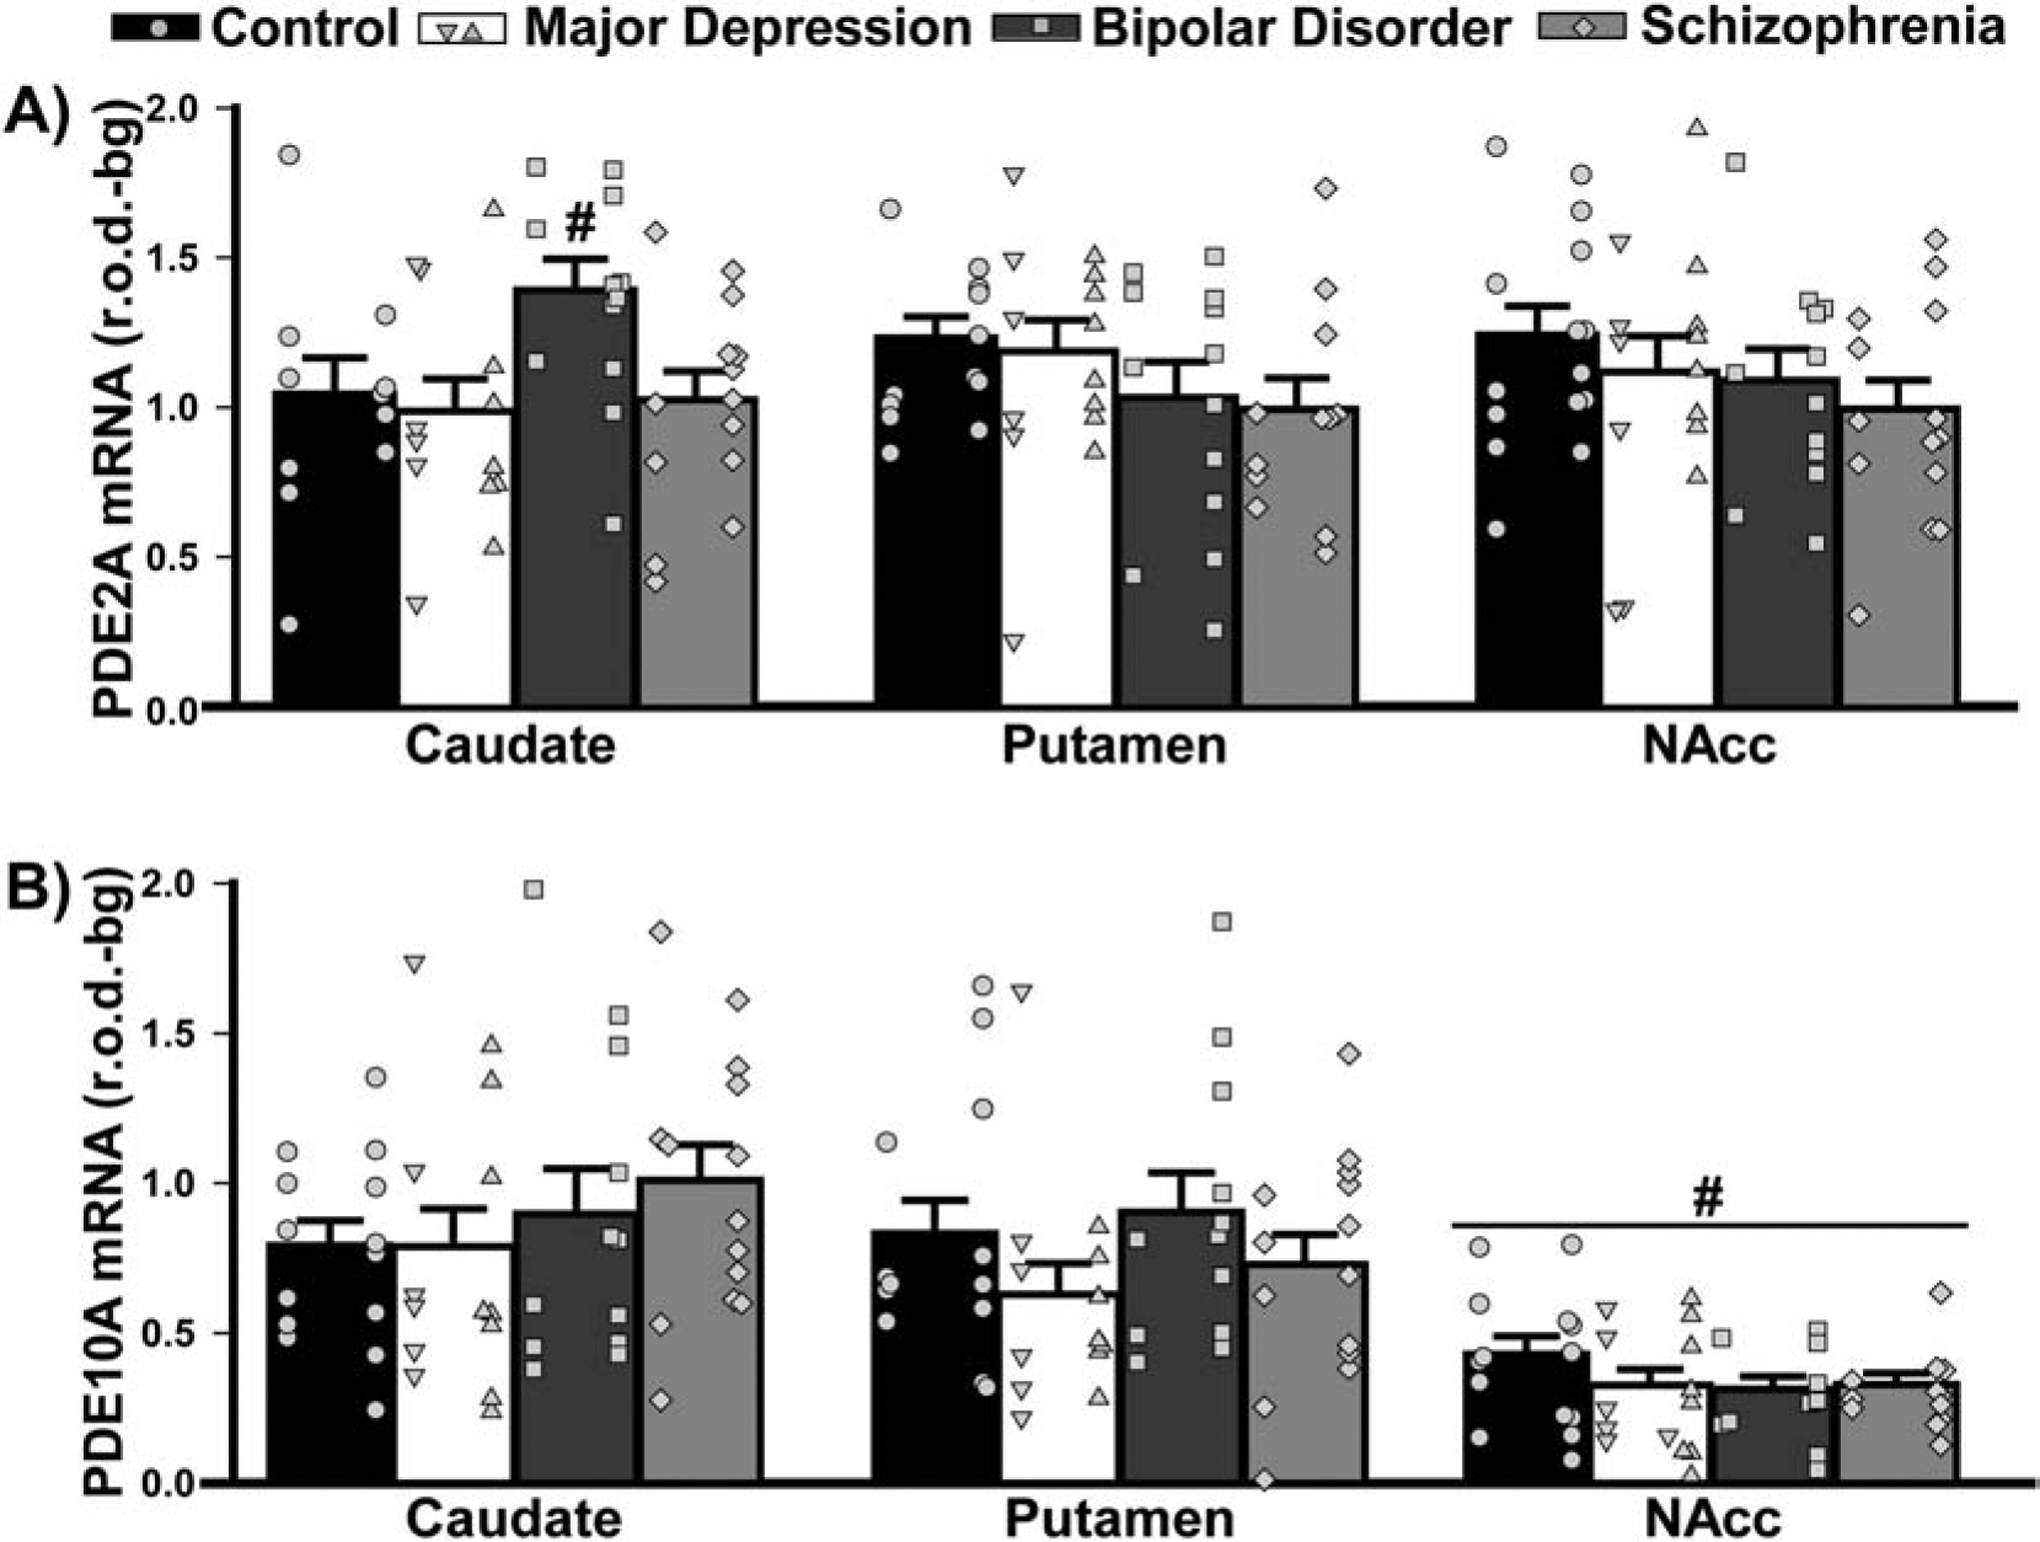
Figure 4. PDE2A and PDE10A mRNA expression in striatum of male and female patients with MDD, BPD, or SCZ.

Group averages are plotted as histograms (Data ±SEM) and overlaid with individual data points for each female (in the left column of each histogram bar) and male subject (in the right column). A) In the striatum, patients with BPD exhibited higher PDE2A mRNA expression in caudate relative to putamen and the NAcc, a pattern that was not seen in other groups (effect of diagnosis x brain region: F(6,93)=2.54, P=0.026; Post hoc, BPD caudate vs. BPD putamen, P=0.0055; vs BPD NAcc, P=0.026). B) In the striatum, PDE10A mRNA expression did not change across groups, but all groups expressed significantly less PDE10A mRNA in the NAcc compared to their own caudate and putamen (effect of region: F(2,95)=65.38, P<0.0001; Post hoc: NAcc vs. caudate or putamen, P<0.0001). #vs. all other regions, P=0.026 to <0.0001.
