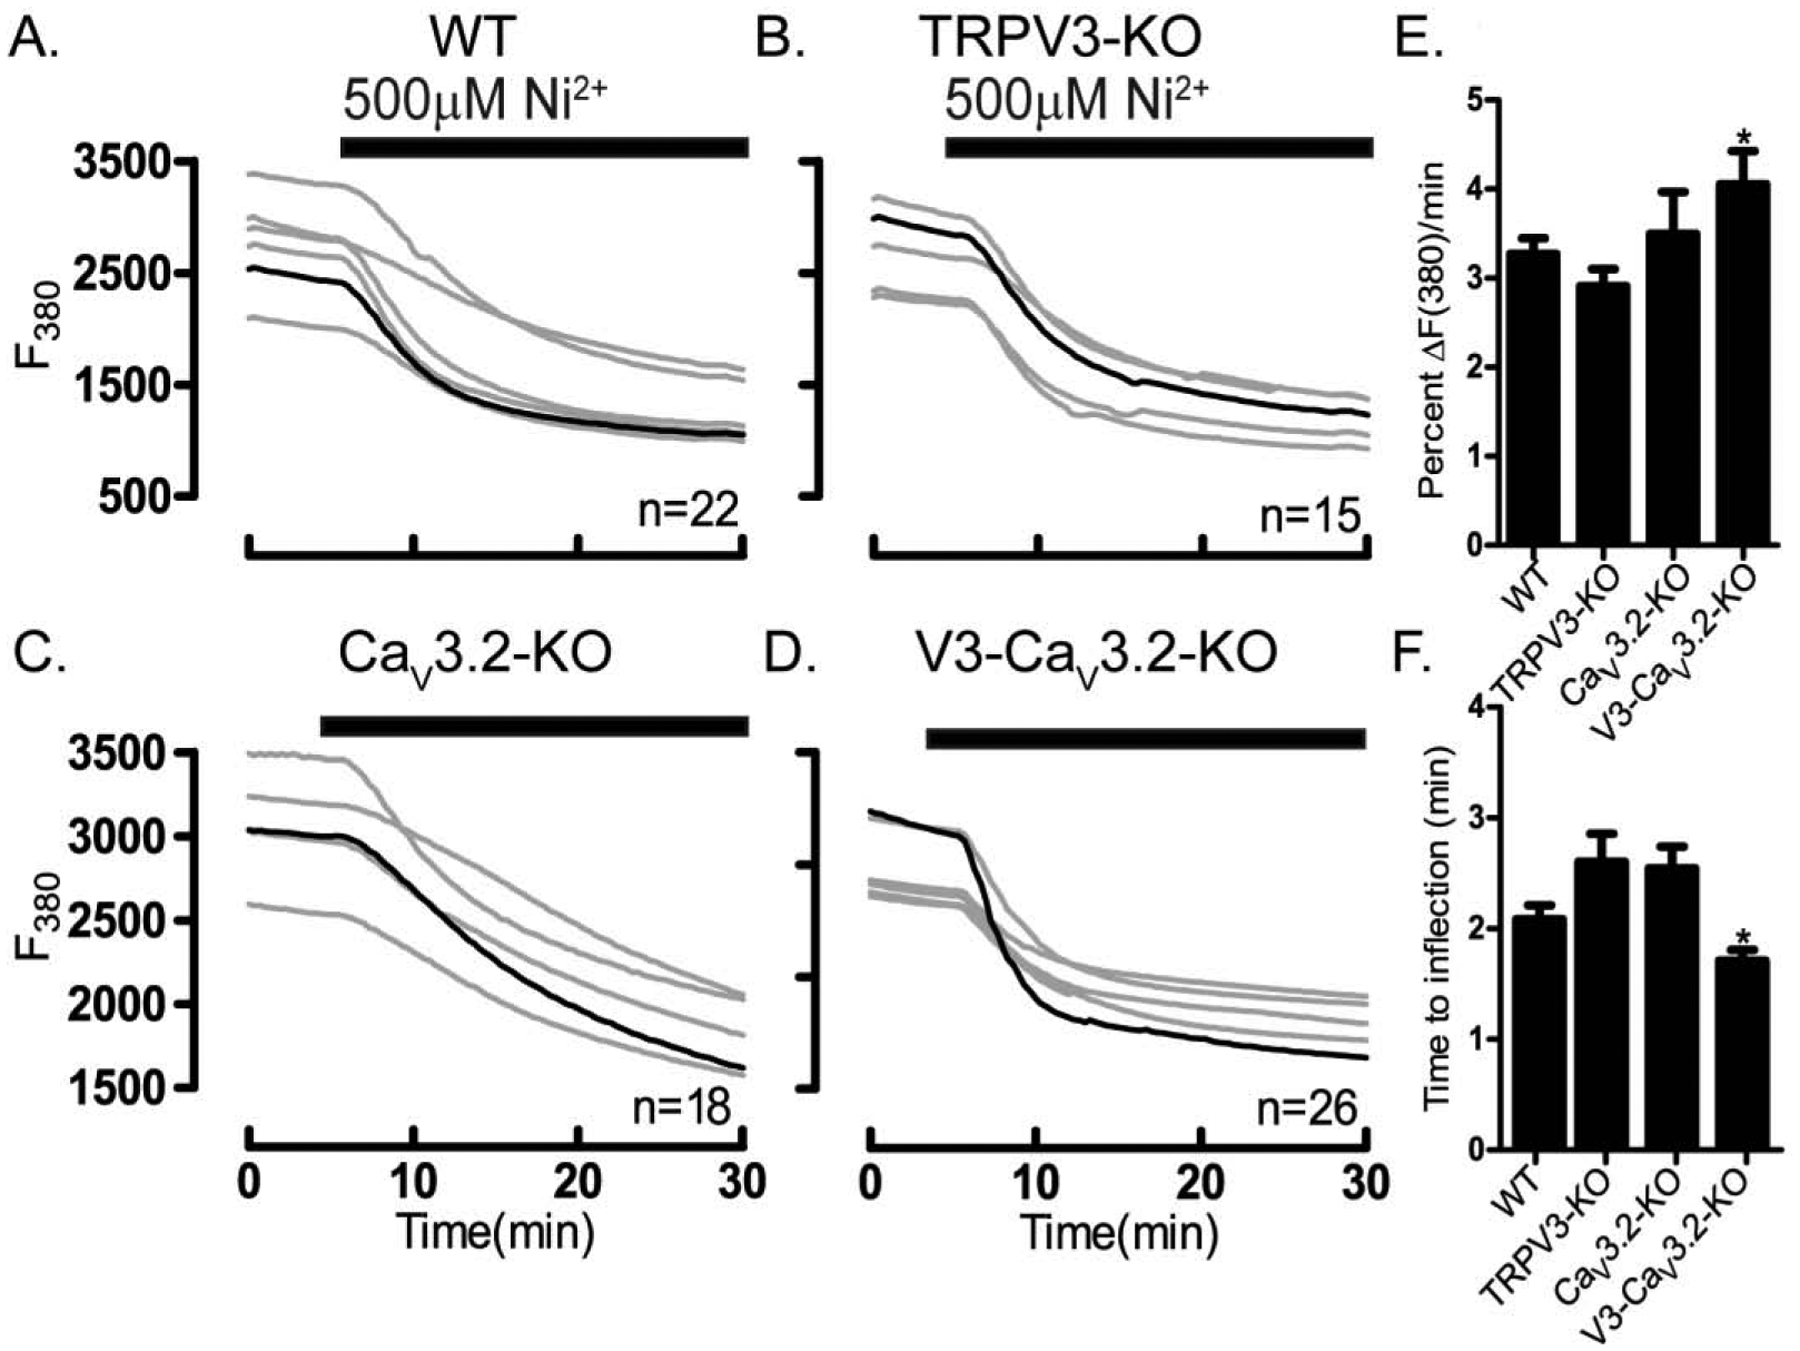
Figure 9. Enhanced Ni2+ influx in V3-CaV3.2-KO oocytes.

Ni2+ influx was tested in WT and oocytes lacking TRPV3, CaV3.2 or V3-CaV3.2 channels. Experiments were performed using Mag-Fura-2AM loaded oocytes in divalent free medium (DFM). Ni2+ influx in (A) WT oocytes, (B) TRPV3-KO oocytes, (C) CaV3.2-KO oocytes, (D) V3-CaV3.2-KO oocytes. (E) Fluorescence quenching at F380 assessed by the rate of fluorescence decrease per minute relative to baseline fluorescence (*P<0.05). (F) Time to inflection measured from the time of addition (5 min) to the time fluorescence quenching begins (*P<0.05). Black bars show the time at which Ni2+ was added. Experiments were replicated three times.
