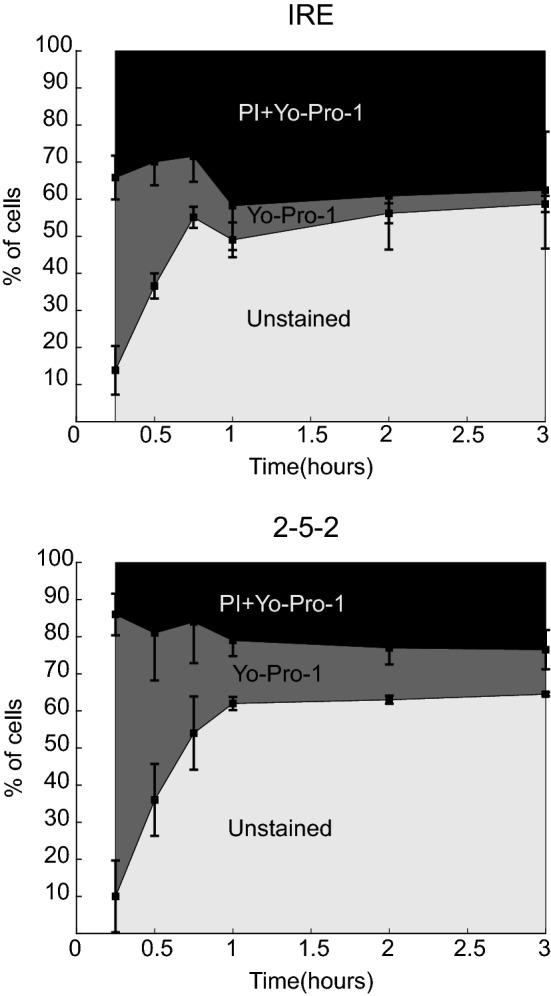
Figure 5.

Time evolution of membrane permeability. Evolution of membrane permeability to PI and Yo-Pro-1 after treatment of cells in suspension with conventional IRE (100 μs monopolar pulses) and 2-5-2 H-FIRE bursts with amplitudes of 1100 and 3800 V/cm, respectively. Squares show the mean percentage of cells permeable to PI and Yo-Pro-1 at different times after treatment (n ≥ 4 for each time point). Error bars show the standard deviation.
