Figure 6.
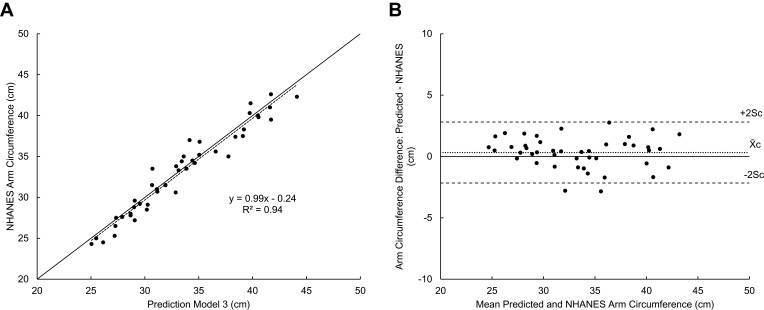
New prediction model (Model 3) accuracy for 44 participants in the holdout dataset. (A) NHANES arm circumference is plotted against the Model 3 predicted arm circumferences. A reference line (y = x) is included. (B) Bland–Altman plots of predicted arm circumference difference versus mean of predicted and NHANES. Differences were calculated by subtracting the Model 3 predicted arm circumferences by their corresponding NHANES measurements. Indications for mean (X̄c) ± 2Sc are shown.

