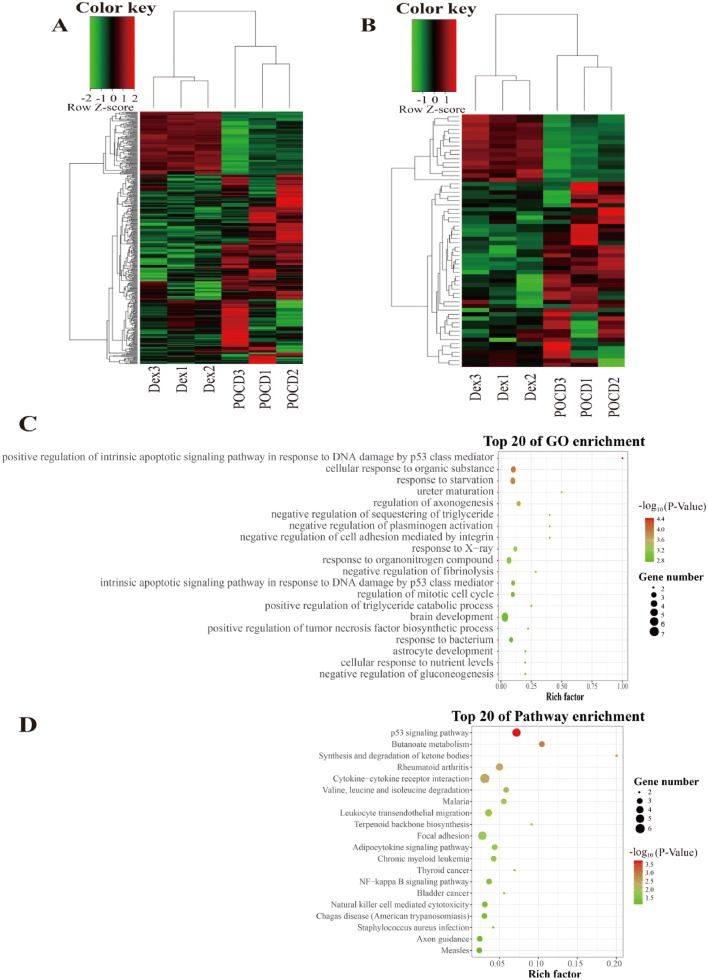
Fig. 3.
Cluster heatmaps of significantly differentially expressed (DE) mRNAs and lncRNAs in POCD rats treated with or without Dex. a Heatmaps of DE mRNAs, b Heat maps of DE lncRNAs. Each column represents a sample. The row shaded in red represents up-regulated genes, and the row shaded in green represents down-regulated genes. c The top 20 GO enrichments based on differentially expressed lncRNA-target genes. d The top 20 KEGG enrichments based on differentially expressed lncRNA-target genes. The left represents the GO term or KEGG pathway, the right represents enrichment, and the size of solid circle indicates the number of genes

