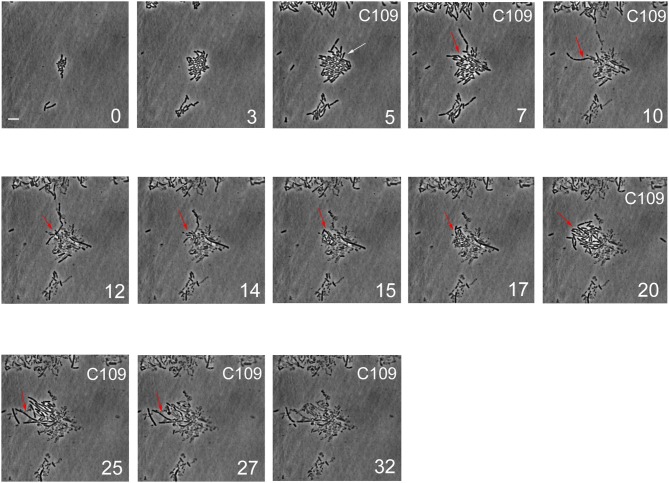
Figure 5.
Single-cell imaging of B. cenocepacia cells treated with C109. Contrast-phase image stacks of B. cenocepacia J2315 during the time-lapse microscopy in the microfluidic chamber. The white arrow indicates a cell that after the C109 treatment died, while a filamentous cell is indicated by the red arrow. Time is indicated in h at the bottom-right corner of each picture. C109 treatment (12.5X-MIC) is indicated on the top-right corner. Scale bar in the first picture is 5 μm.

