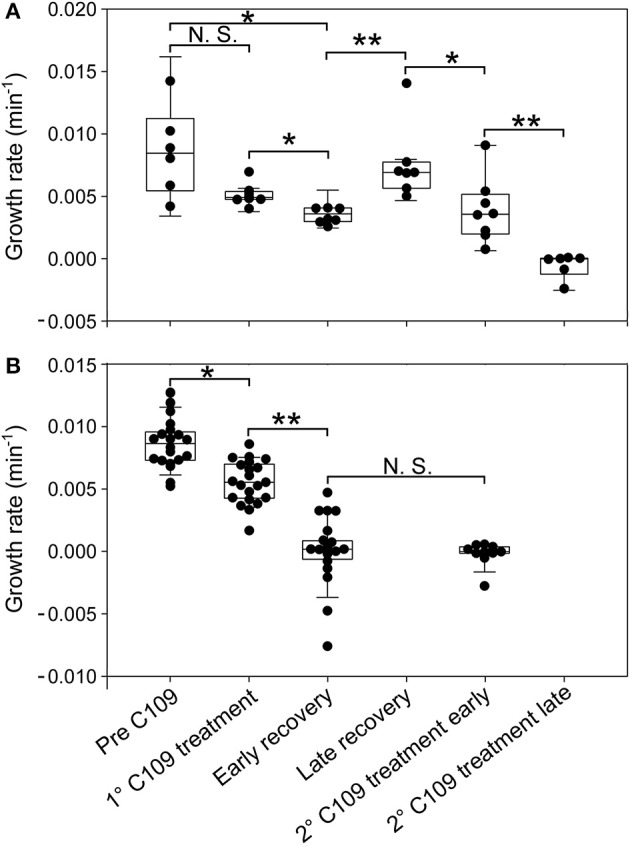
Figure 6.

Single-cell analysis of growth rate for different cell categories. Single-cell growth rate of survivor cells (A) and cell dead by lysis (B) prior to and following C109 exposure (n = 30). Early recovery was defined between 6 and 10 h and late recovery was defined between 10 and 18 h, from the beginning of the experiment. 2nd C109 treatment early is defined between 19 and 22 h and 2nd C109 treatment late is defined between 22 and 46 h from the beginning of the experiment. The data shown are from 2 independent experiments. Black lines indicate mean ± SD. Asterisks denote significance by Paired samples T-test: N.S., not significant; *p ≤ 0.05 and **p ≤ 0.01.
