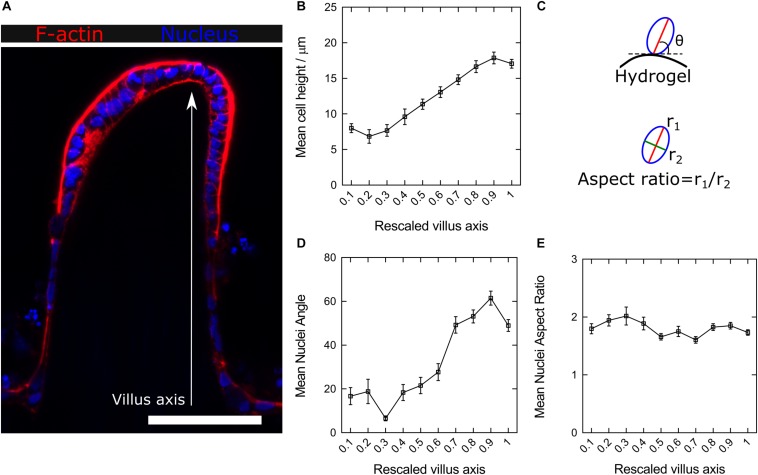
FIGURE 4.
(A) Confocal microscopy image of F-actin and nuclei staining of the Caco-2 monolayer formed on top of microstructured hydrogels after 21 days in culture. Scale bar: 100 μm. (B) Average cell heights along the rescaled villus axis. (C) Schematic drawing showing the nuclei orientation (the major axis angle of the fitted ellipse with respect to the hydrogel surface) and elongation (the ratio between the major to the minor axes of the fitted ellipse) analysis. (D) Change in the mean nuclei angle (nuclei orientation) and (E) nuclei aspect ratio (nuclei elongation) along the rescaled villus axis. Data presented as mean ± standard error of the mean (SEM).

