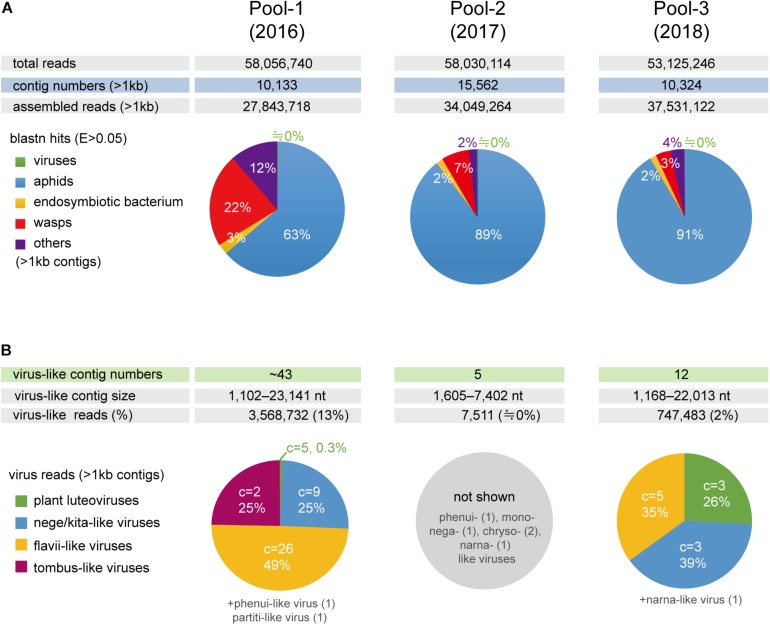
FIGURE 1.
Number of de novo-assembled contig sequences in the three libraries (pools 1–3) derived from the barley aphid transcriptomic analysis using NGS. (A) Distribution of the contigs based on organisms (aphids, parasitoid wasps, endosymbiont bacterium, viruses, and others) analyzed using BlastN matches with an e-Value < 0.05 for the selected reference sequence data (transcriptomic or genomic sequences) (see Section “Materials and Methods”). (B) The number of raw reads mapping to virus-like contig sequences related to different viral groups (families or proposed taxa). Charts show the percentage of raw read, estimated using a read mapping approach, according to the virus groups in each library, except for pool-2, where only a small number of virus-like contigs were identified. C = the number of virus-like contigs.

