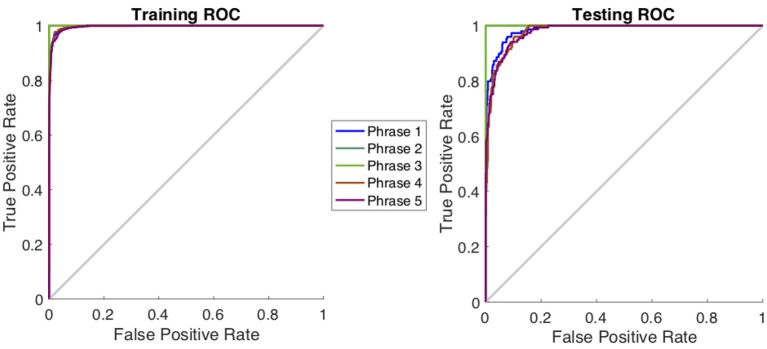
Figure 9.
Receiver operating characteristics curve for one subject during the classification of phrases in the articulation stage using AlexNet. The plot represents the variation between true positive rate (sensitivity) and true negative rate (1-specificity) to indicate the classification performance. For this curve average AUC >0.96 indicating a very high classification performance.

