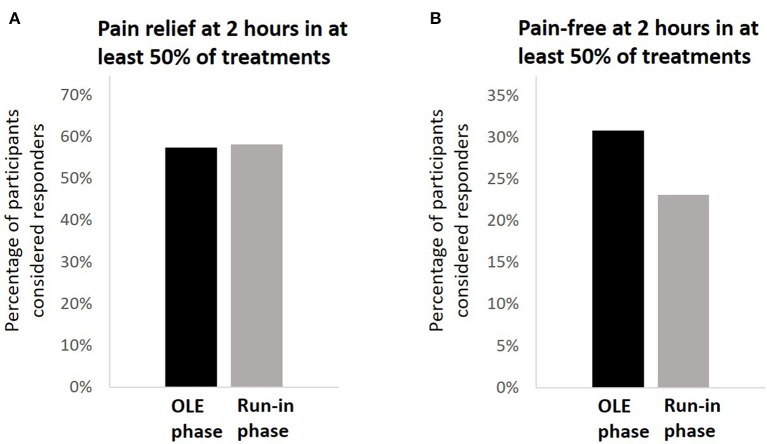
Figure 4.
Comparison of clinical pain outcomes. (A) The percentage of participants achieving pain relief at 2 h post-treatment in a least 50% of their treatments in the open-label extension phase (black) compared with the run-in phase (gray). (B) The percentage of participants achieving pain freedom at 2 h post-treatment in a least 50% of their treatments in the open-label extension phase (black) compared with the run-in phase (gray).

