Figure 1.

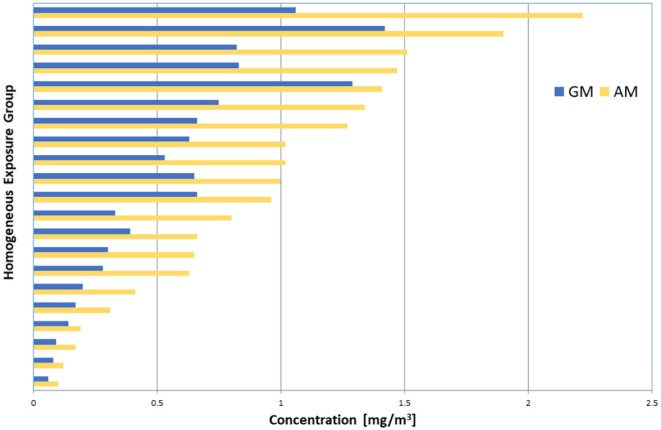
Plot of the AM (yellow bars) and GM (blue bars) of personal coal dust concentrations of 21 HEGs with > 15 data points. Data (N = 684) were collected from 6 coal mines in 2015.

Plot of the AM (yellow bars) and GM (blue bars) of personal coal dust concentrations of 21 HEGs with > 15 data points. Data (N = 684) were collected from 6 coal mines in 2015.