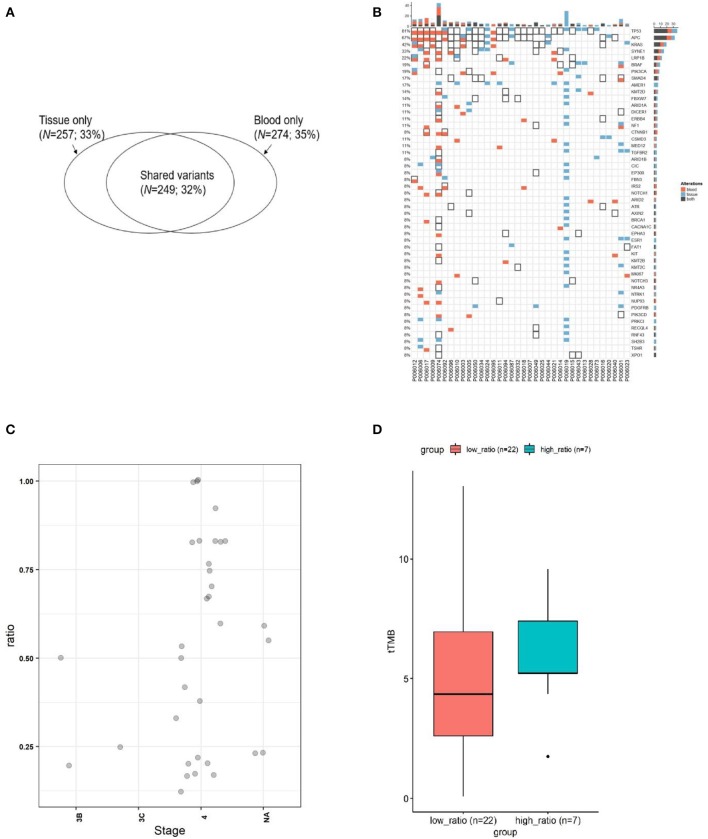
Figure 2.
The concordance of mutation between ctDNA and the corresponding tumor tissues from CRC. (A) Wenn diagram shows the number and percentage of overlapped and unique mutations between the tissue DNA and the corresponding blood ctDNA samples. (B) Mutation spectrum of baseline plasma and the corresponding tumor tissues from 35 subjects. (C) The mutation concordance ratio for different stages between blood ctDNA samples and tumor tissue samples from 28 patients. (D) Comparison of tumor mutation burden (TMB) in low consistency (<75%) and high consistency (>75%) groups.

