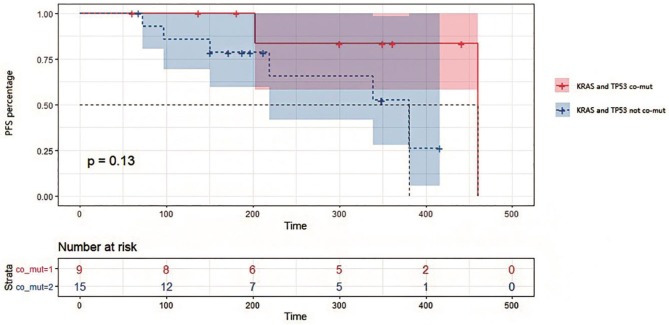
Figure 5.
Kaplan-Meier survival analysis on progression-free survival in patients with or without KRAS and TP53 co-mutations in tissues. Survival curves were compared by Log-rank (Mantel-Cox) test. P = 0.13 for statistical comparison between the two groups. Data was represented with 95% confidence interval.

