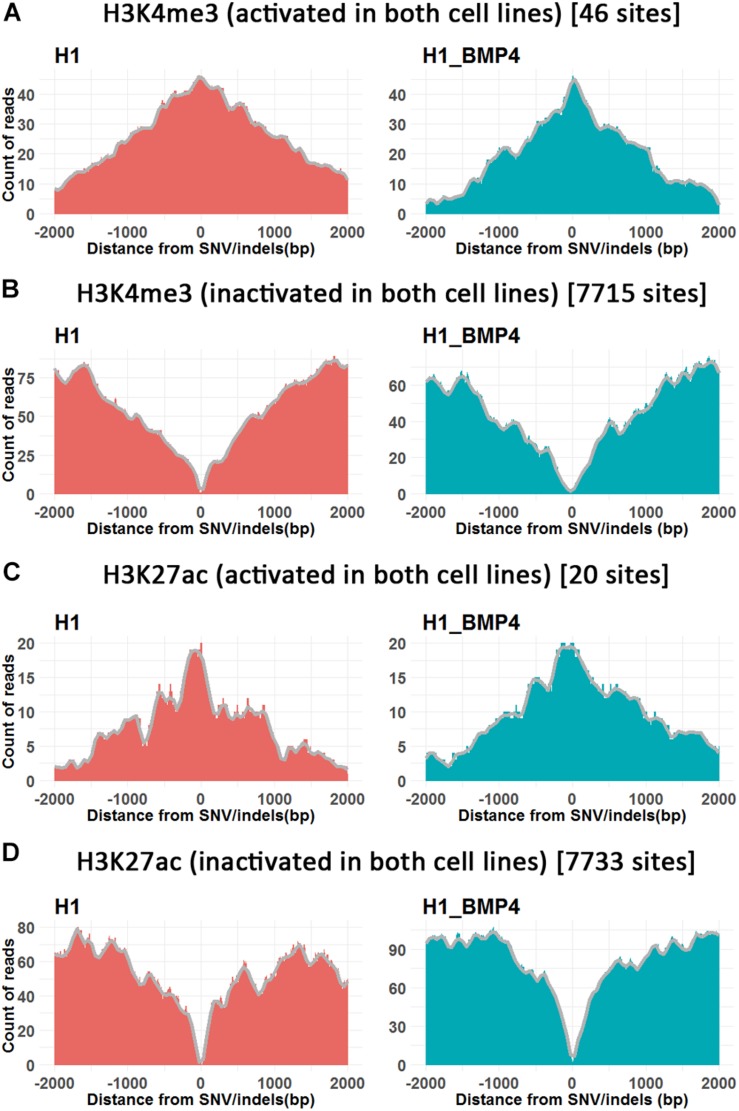
FIGURE 4.
The histone modifications surrounding SNV/indels. X-axis is the upstream and downstream 2 Kbp relative to SNV/indels sites. (A,B) The number of peak counts on the genomic variations which are located in both promoter activated (A) or inactivated (B) around H3K4me3 between H1 and H1_BMP4. (C,D) The number of peak counts on the genomic variations which are located in both enhancer activated (C) or inactivated (D) around H3K27ac between H1 and H1_BMP4. The number in parentheses indicates the number of SNV/indels. Complete profiles are shown in Supplementary Figure S4.

