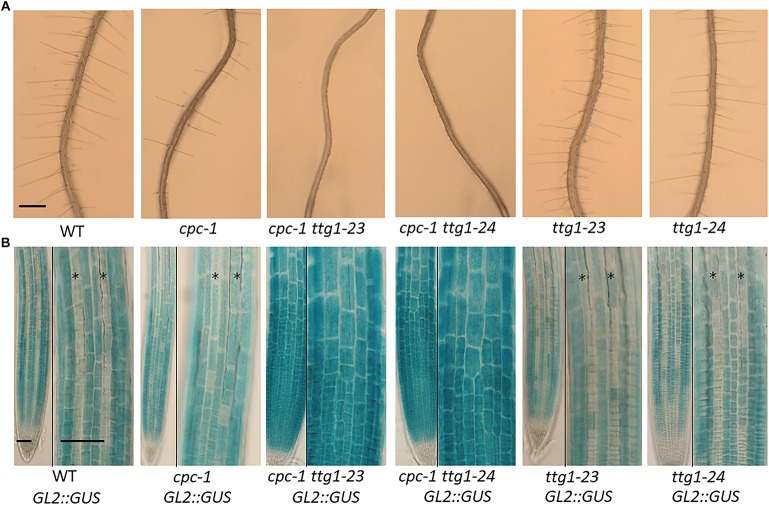
FIGURE 1.
Characterization of the ttg1-23 and ttg1-24 mutants. (A) Seedling roots of wild type, cpc-1, cpc-1 23, cpc-1 24, 23, and 24 displaying their root hair phenotypes. Bar = 200 μm. (B) GL2:GUS reporter expression in seedling root tips of wild type, cpc-1, cpc-1 23, cpc-1 24, 23, and 24. Stars indicate H-position epidermal cell files. For each panel, the left and right images show the same root under different magnification. Bar = 50 μm.

