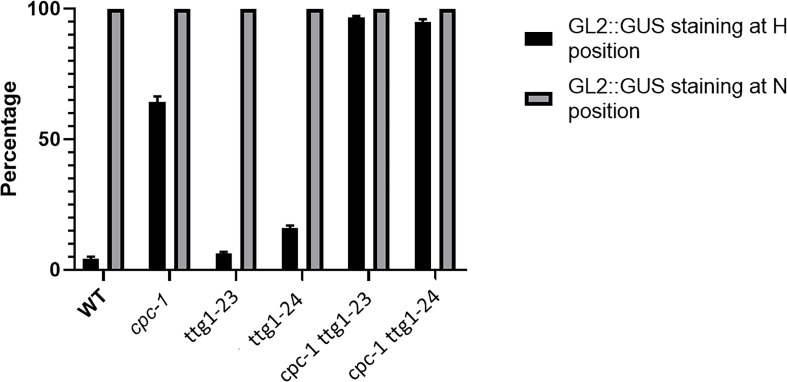
FIGURE 2.
Histograms of GL2:GUS expression in H-position and N-position root epidermal cells of WT, cpc-1, ttg1-23, ttg1-24, cpc-1 ttg1-23, and cpc-1 ttg1-24 seedling root tips. Ten cells from each of the H and N positions in each root were measured. Ten seedling roots were analyzed for each replicate. Three independent biological replicates were performed for each genotype. Data shown are means (+SD).

