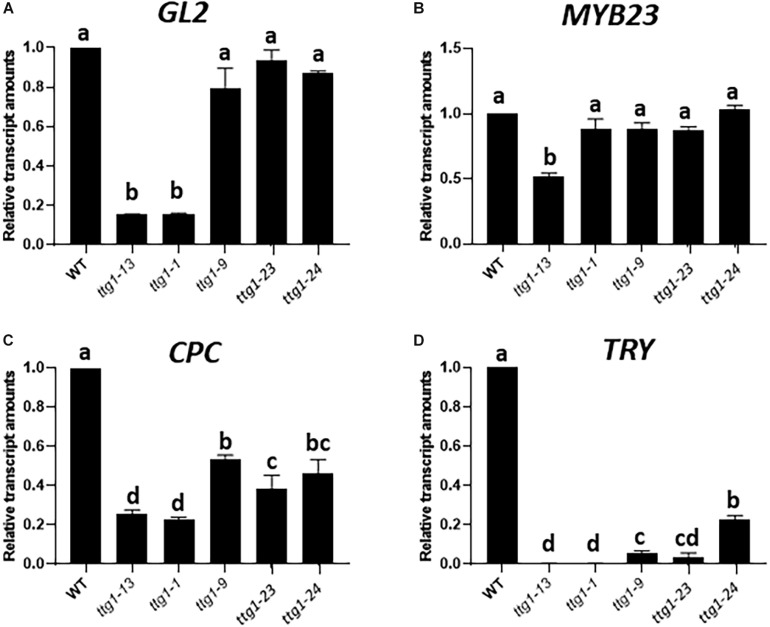
FIGURE 6.
Relative transcript amounts from (A) GL2, (B) MYB23, (C) CPC, and (D) TRY genes from seedling root tips of WT, ttg1-13, ttg1-1, ttg1-9, ttg1-23, and ttg1-24, determined with RT-qPCR. Three independent biological replicates were performed for each genotype. Error bars represent standard deviations. For each panel, bars marked with the same letter indicate values not significantly different; bars marked with different letters indicate values showing statistically significant differences (P < 0.05; ANOVA testt).

