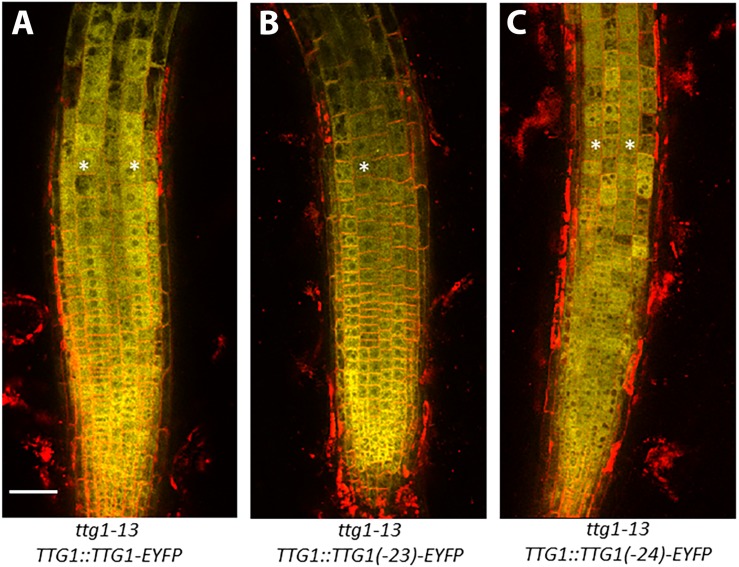
FIGURE 8.
Accumulation of TTG1-EYFP fusion proteins in ttg1-13 seedling roots bearing the (A) TTG1:TTG1(WT)-EYFP, (B) TTG1:TTG1(ttg1-23)-EYFP, or (C) TTG1:TTG1(ttg1-24)-EYFP transgene. White stars mark the H-position epidermal cell files. The red color represents propidium iodide and the yellow color represents YFP. Representative images are shown from the analysis of at least 3 independent single-insertion lines for each transgenic experiment. Bar = 50 μm.

