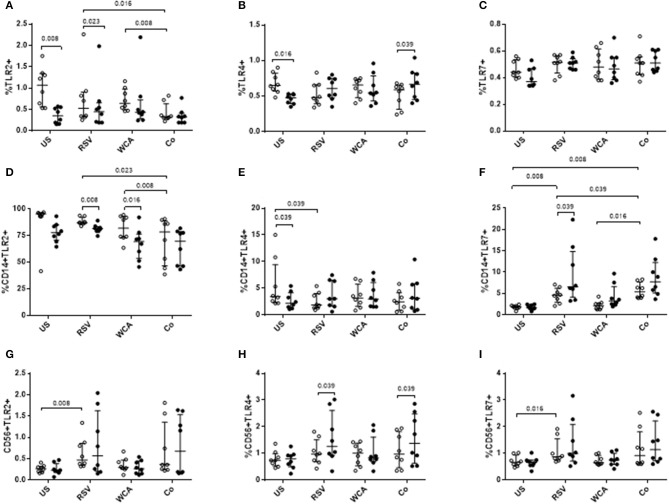
Figure 4.
The effect of VitD3 on TLR expression in PBMCs. 1 × 10⁶ PBMCs/mL were treated with VitD3 (100 nmol/L) at the time of stimulation. PBMCs were stimulated with live RSV at an MOI = 1, WCA (1 μg/mL) or WCA-RSV (designated “co”) prior to phenotyping by flow cytometry. Cell populations were determined by positive staining for cell surface obtained from live single lymphocytes. (A) TLR2+, (B) TLR4+, (C) TLR7+, (D) CD14+TLR2+, (E) CD14+TLR4+, (F) CD14+TLR7+, (G) CD56+TLR2+, (H) CD56+TLR4+, (I) CD56+TLR7+. Open circles represent untreated PBMCs, whilst closed circles represent VitD3 treated PBMCs. Data shown represents median ± IQR; n = 8 per group.

