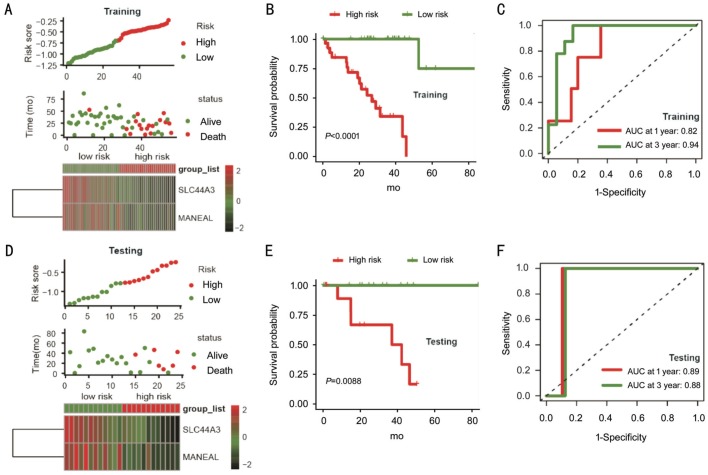
Figure 3. The IPS-based risk score predicted the OS of UM patients in the training and testing sets.
A, D: Risk score distribution, survival status of each patient, and expression distribution of selected genes in training and testing cohorts. B, E: Kaplan-Meier survival curve of UM patients in the high- and low-risk subgroups of the training and testing sets. C, F: Time-dependent ROC curve analysis of the IPS in training and testing sets.

