Fig. 1.
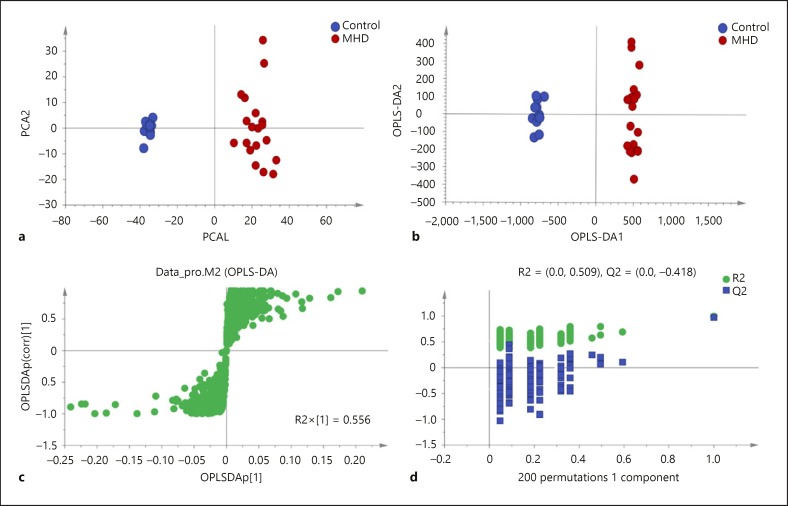
Plasma metabolic profiles of LSMs for the MHD patients and healthy controls. a Two-dimensional PCA score plots show visual separation of MHD patients (red dots) from the healthy controls (blue dots). R2X = 0.459, Q2 = 0.361. The percentage variation in the plotted principal components is marked on the axes. Each spot represents one sample, and each group is indicated by a different color. b Two-dimensional OPLS-DA score plots highlight the difference between the patients (red dots) and healthy controls (blue dots). R2X = 0.598, R2Y = 0.995, Q2 = 0.976. c S-plots of the OPLS-DA models for the processed data. d Permutation plots for the MHD patients and controls all show that the OPLS-DA models used above are valid. The green dots represent R2 while blue dots represent Q2. The number of permutations for each plot was 200.

