FIGURE 2.
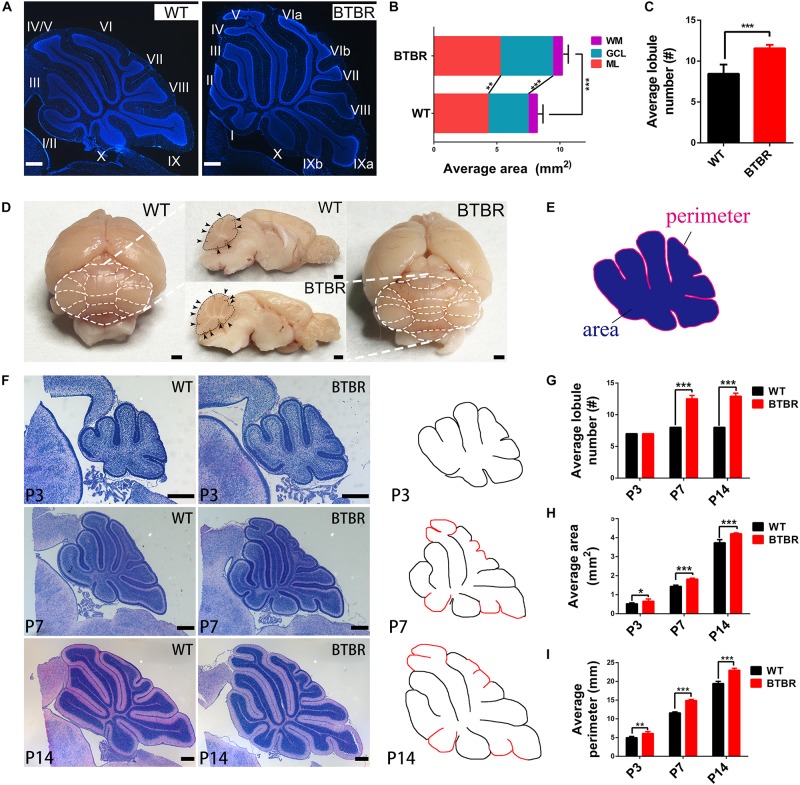
Cerebellar cortex in BTBR mice was expanded with increased foliation since post-natal. (A) DAPI stained cerebella of WT and BTBR mice at adult stage (P90). (B) Quantification of the sagittal area of cerebella and each component at adulthood (Student’s t-test; n = 6, 7 mice). (C) Quantification of the average lobe number showing increased foliation of adult BTBR mice (Student’s t-test; n = 6, 7 mice). (D) Whole mount images and sagittal section of brain in WT and BTBR mice at adult stage (P90). White and black dotted line delimit the lobule outline. Black arrowheads indicate the lobule fissures. (E) Schema graph illustrating the determination of perimeter and area. (F) Hematoxylin-eosin (HE) staining of middle sagittal cerebellar section at postnatal day 3, 7, and 14 (additional lobes highlighted in red in the counterdraw). (G) Quantification of the average lobule number in WT and BTBR mice at indicated stage (Student’s t-test; P3 n = 6,5; P7 n = 6,6; P14 n = 5,6). (H) Quantification of the average sagittal cerebellar area in WT and BTBR mice at indicated stage (Student’s t-test; P3 n = 6, 5; P7 n = 6, 6; P14 n = 5, 6). (I) Quantification of the average sagittal cerebellar section perimeter in WT and BTBR mice at indicated stage (Student’s t-test; P3 n = 6,5; P7 n = 6,6; P14 n = 5,6). All data are displayed as mean ± SD. *P < 0.05, **P < 0.01, ***P < 0.001. Scale bar: (A,F) 200 μm; (D) 1 mm.

