FIGURE 5.
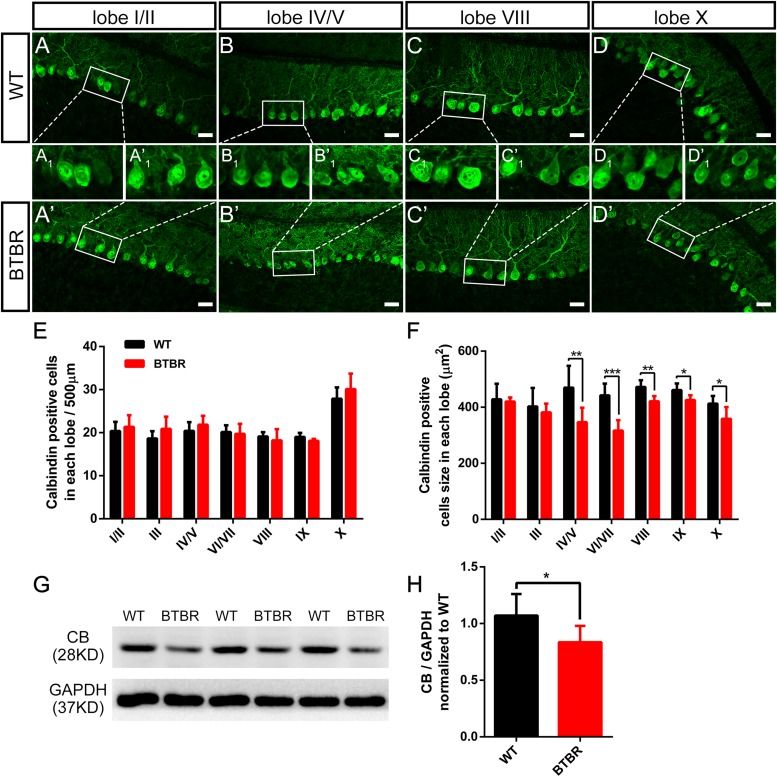
Purkinje neurons’ density did not variate but was significantly hypotrophy in BTBR mice at postnatal day 14. (A–D) Calbindin staining Purkinje neurons in cerebellar lobe I/II, IV/V, VIII, X of WT (A–D) and BTBR (A’–D’) mice at P14. Purkinje neuron somas in white panels are magnified in (A1-D1,A’1–D’1). (E) Quantification of Purkinje neurons number per 500μm in lobe I-X (Student’s t-test; n = 6,6). (F) Quantification of Purkinje neurons soma size showing hypotrophy in lobe VI-X of BTBR mice. (Student’s t-test; n = 6,6). (G) Representative image of western blotting for calbindin protein in WT and BTBR mice at P14. (H) Densitometric quantification of calbindin showing decreased expression in BTBR mice cerebella (Student’s t-test; n = 6,6). All data are displayed as mean ± SD. *P < 0.05, **P < 0.01, ***P < 0.001. Scale bar: (A–D) 25 μm.

