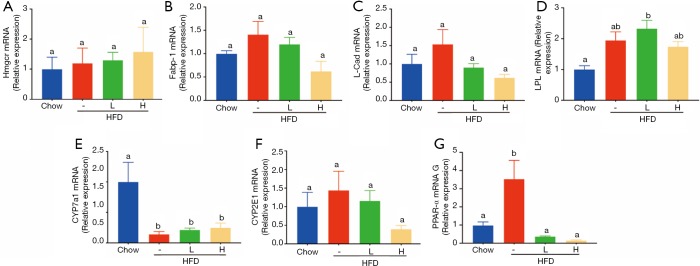
Figure S2.
mRNA levels of genes related to fatty acid synthesis, β-oxidation, bile acid and cholesterol metabolism in liver. (A) 3-hydroxy-3-methylglutaryl CoA reductase (Hmgcr), (B) fatty acid binding protein 1 (Fabp1), (C) long chain acyl-CoA dehydrogenase (Lcad), (D) lipoprotein lipase (Lpl), (E) Cholesterol 7a-hydroxylase (Cyp7a1), (F) Cytochrome P450 Family 2 Subfamily E Member 1(CYP2E1), and (G) peroxisome proliferation-activated receptor (PPAR)-α levels were analysed by qRT-PCR. The values were presented as mean ± S.E.M. (n=6 per group). Graph bars with different letters on top represent statistically significant results (P<0.05) based on Newman-Keuls post hoc one-way ANOVA analysis, whereas bars with the same letter correspond to results that show no statistically significant differences.

