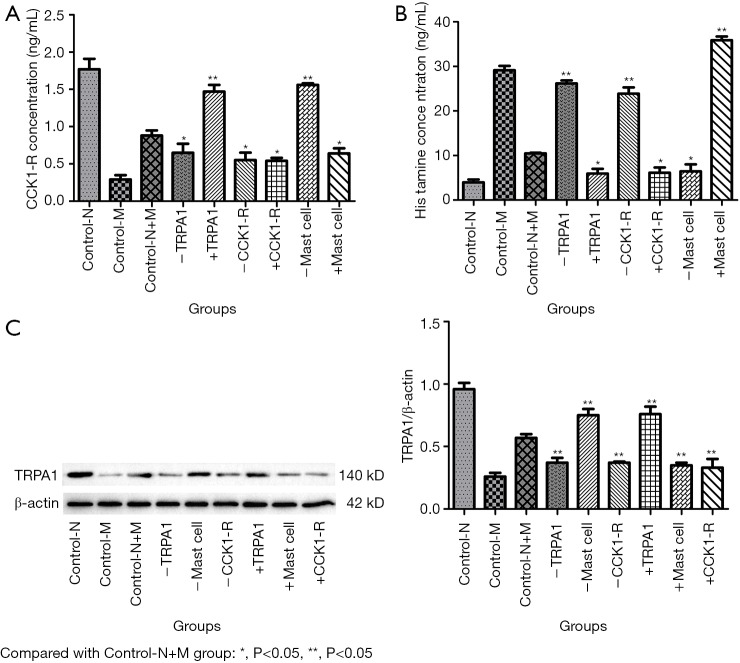
Figure 6.
CCK1-R (A) and histamine (B) concentration in supernatant and expression of TRPA1 protein (C) and mRNA (D) in neurons. Control-N, Control-M, Control-N+M, -TRPA1, -Mast cell, -CCK1-R, +TRPA1, +Mast cell and +CCK1-R represent DRG group, Mast cell group, DRG and mast cell group, TRPA1 inhibitor group, Mast cell stabilizer group, CCK1-R inhibitor group, TRPA1 enhancer group, Mast cell enhancer group and CCK1-R enhancer group respectively.

