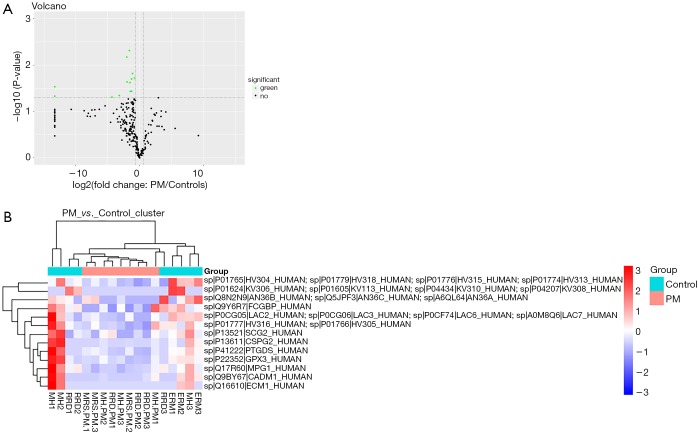
Figure 2.
Differentially expressed proteins in the VH of PM patients and controls (label free quantitative proteomics analysis). (A) Volcano plot represents the differentially expressed protein. The −log10 (P value) is plotted against the difference of the means of two groups (PM and controls). Dots above the non-axial horizontal line are significantly differentially expressed proteins. Thirteen proteins were found to be significantly (P<0.002) downregulated in the PM samples (green plots), while none was upregulated (red plots), and the proteins with unchanged expression were marked with dark dots. (B) Hierarchical clustering analysis of 13 differentially expressed proteins between PM patients and controls. Protein names are listed on the right, group names are indicated at the top while the subgroups are listed at the bottom. The color key on the left of the heatmap indicates the expression level (red = up-regulation, blue = downregulation). VH, vitreous humor; PM, pathological myopia; ERM, epiretinal membrane; MH, macular hole; RRD, rhegmatogenous retinal detachment; MRS, myopic retinoschisis.

