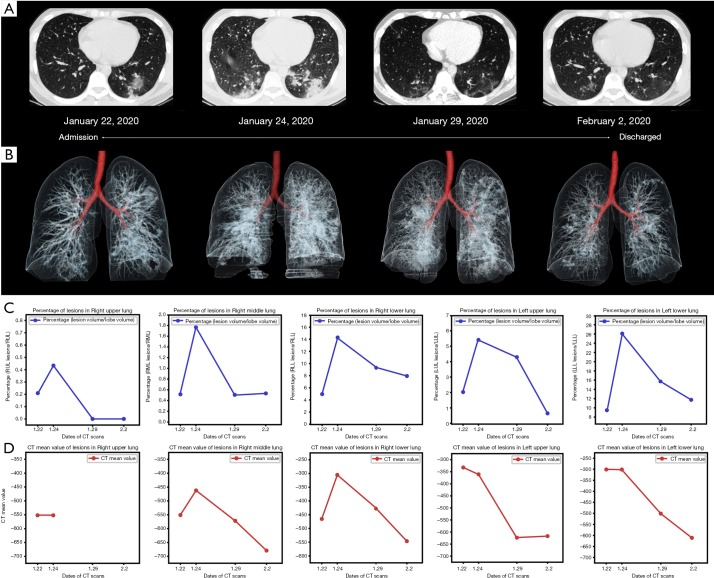
Figure 1.
CT imaging of coronavirus disease 2019 (COVID-19). (A) Chest CT shows patchy ground-glass opacity and a few subpleural consolidations in the left lower lobe on admission; Image obtained 2 days after follow-up shows the pneumonia progressed with distribution in bilateral lower lobes, predominantly manifesting as consolidation; images obtained 7 and 11 days after follow-up show the pneumonia absorbed gradually. (B) Three-dimensional volume-rendered reconstruction shows the visible progression and regression of pulmonary lesions. (C) The lesion percentage in each lung lobe shows obvious progression in the second CT scan, and indicates marked improvement in the following CT images obtained 7 and 11 days after follow-up. (D) The CT mean density values in each lung lobe shows a similar change of the lesion percentage at time of CT examination.

